
Summary statistics from LDAK-KVIK
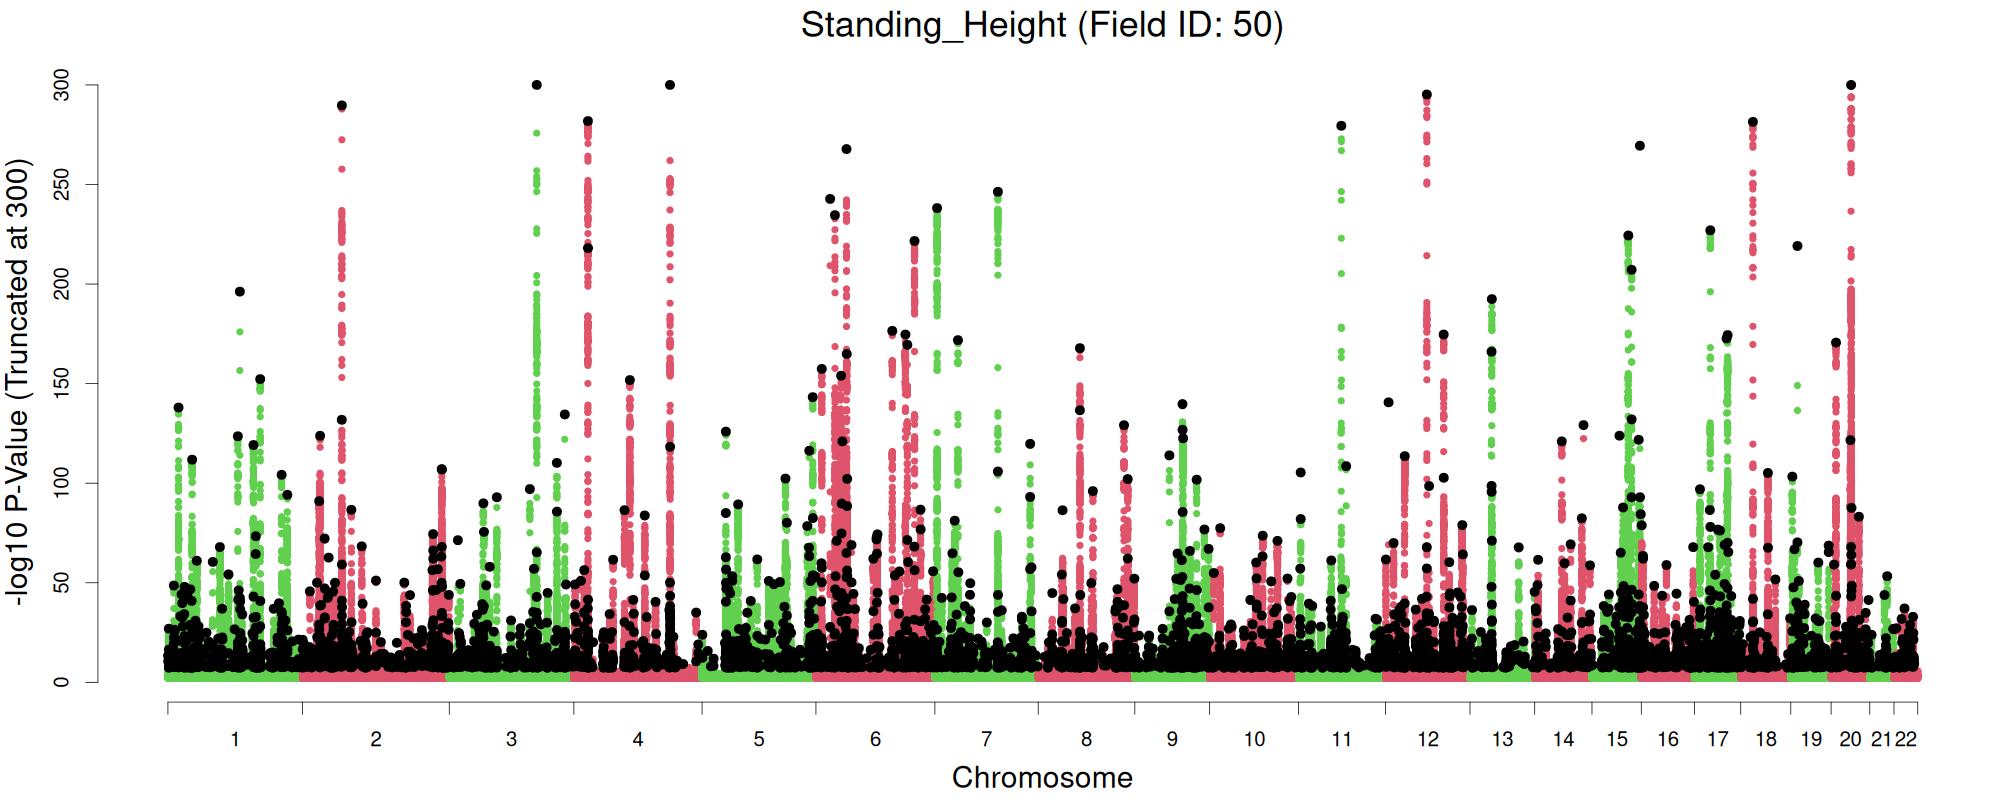
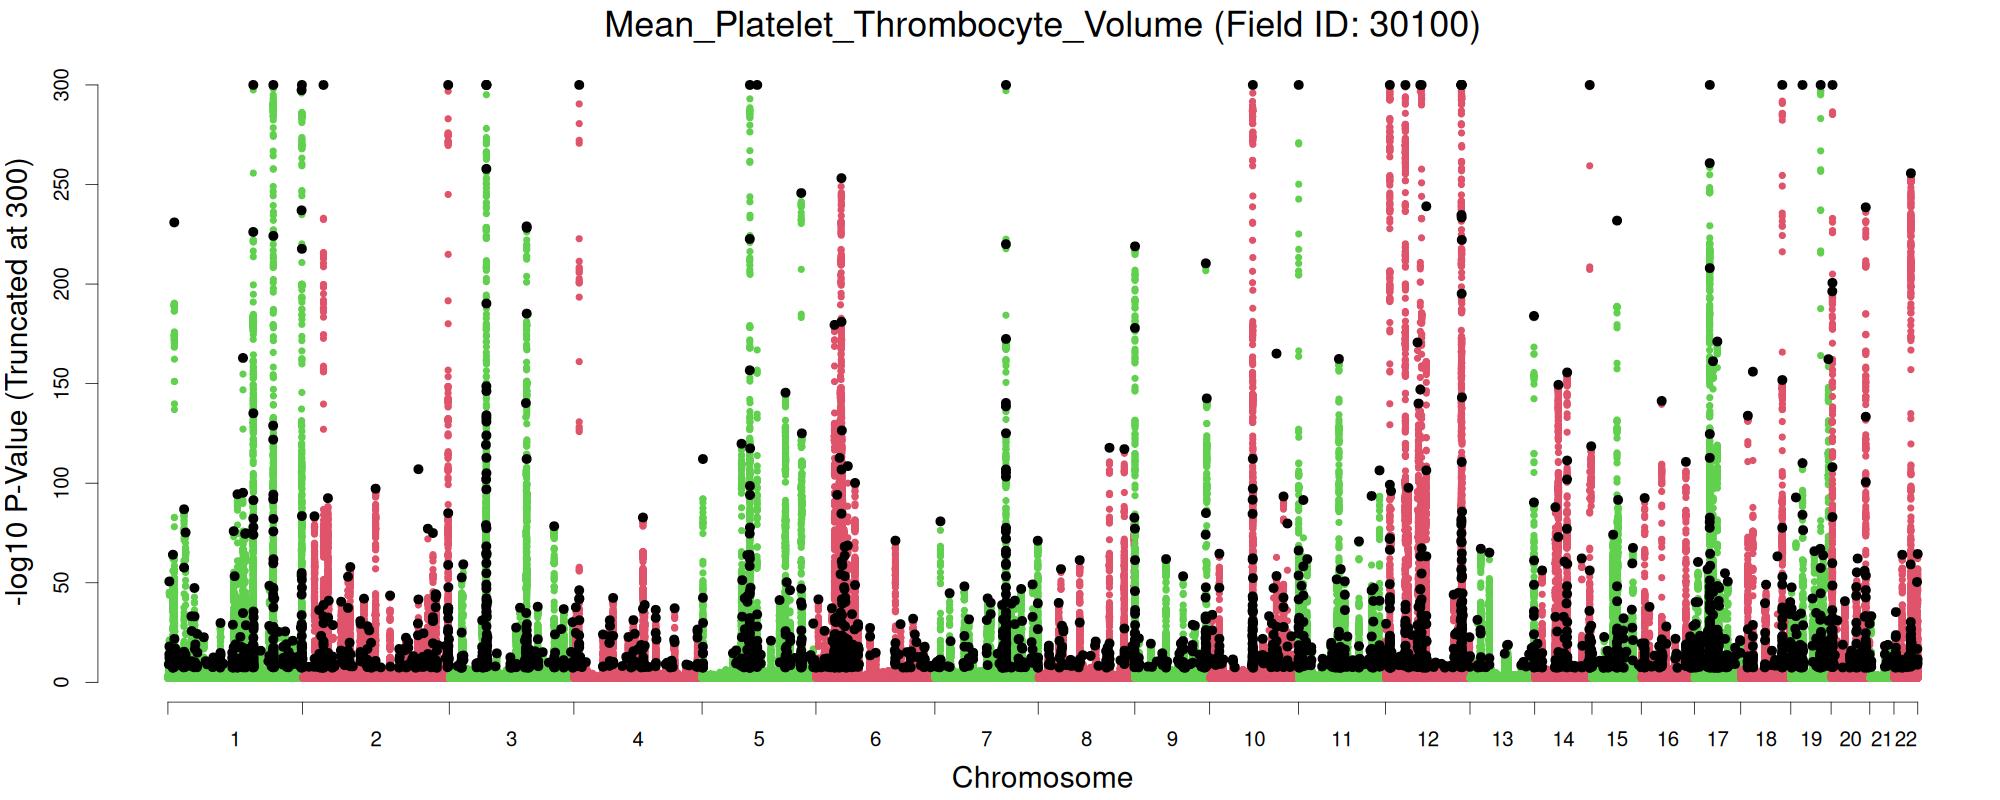
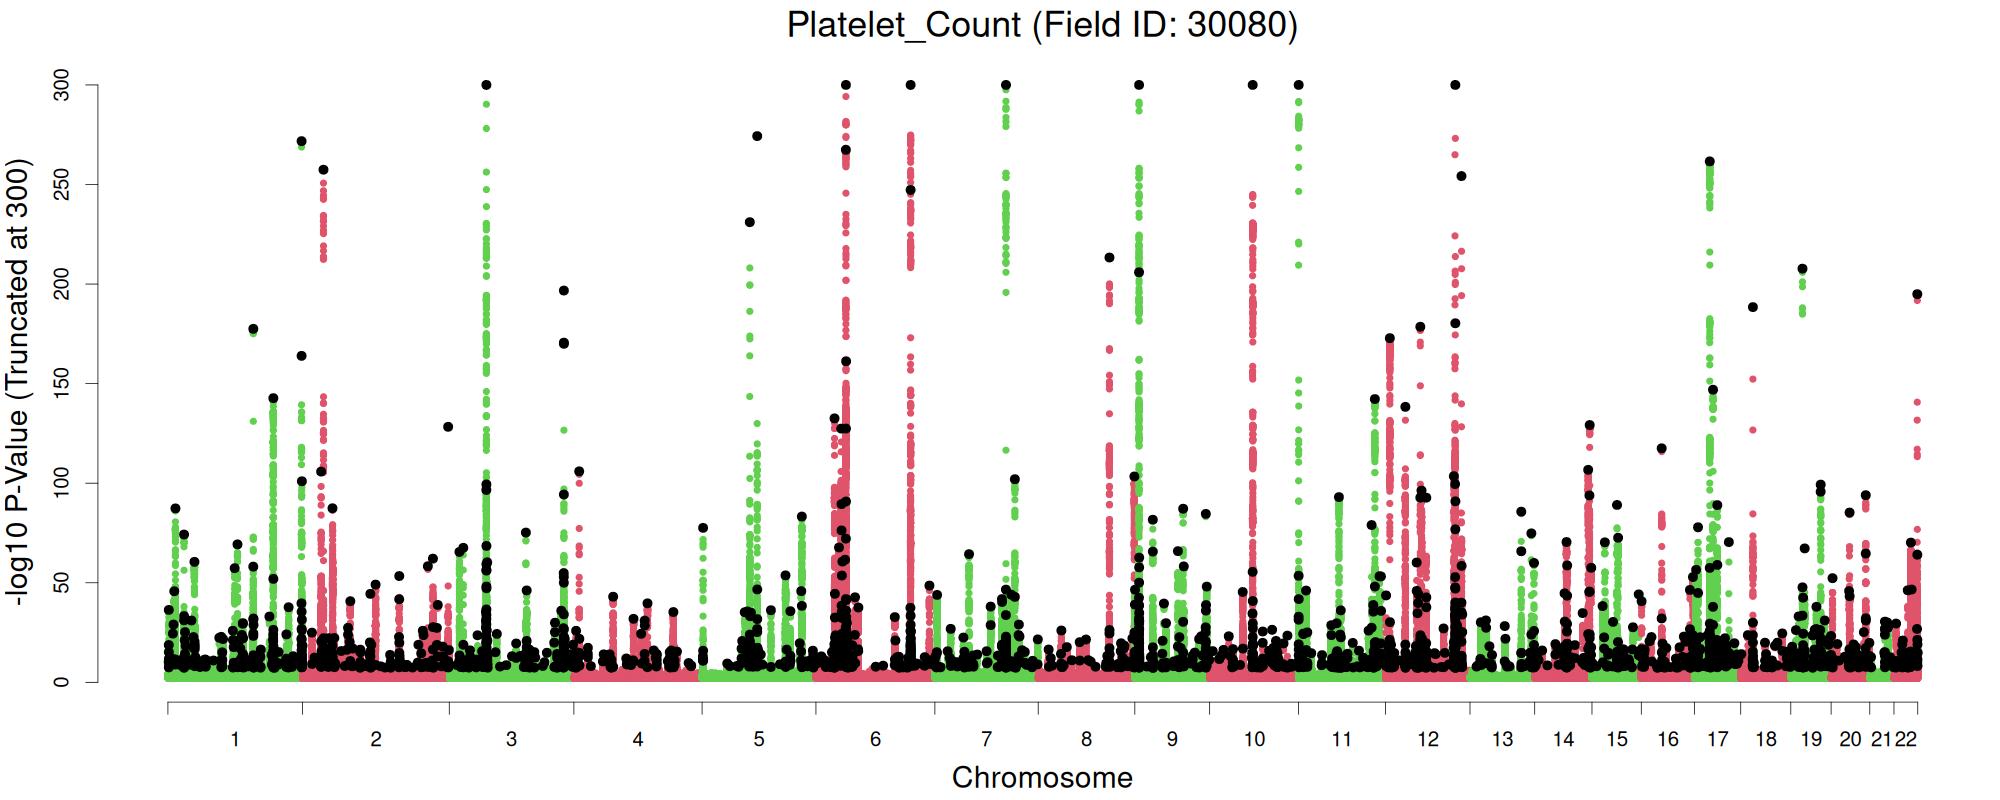
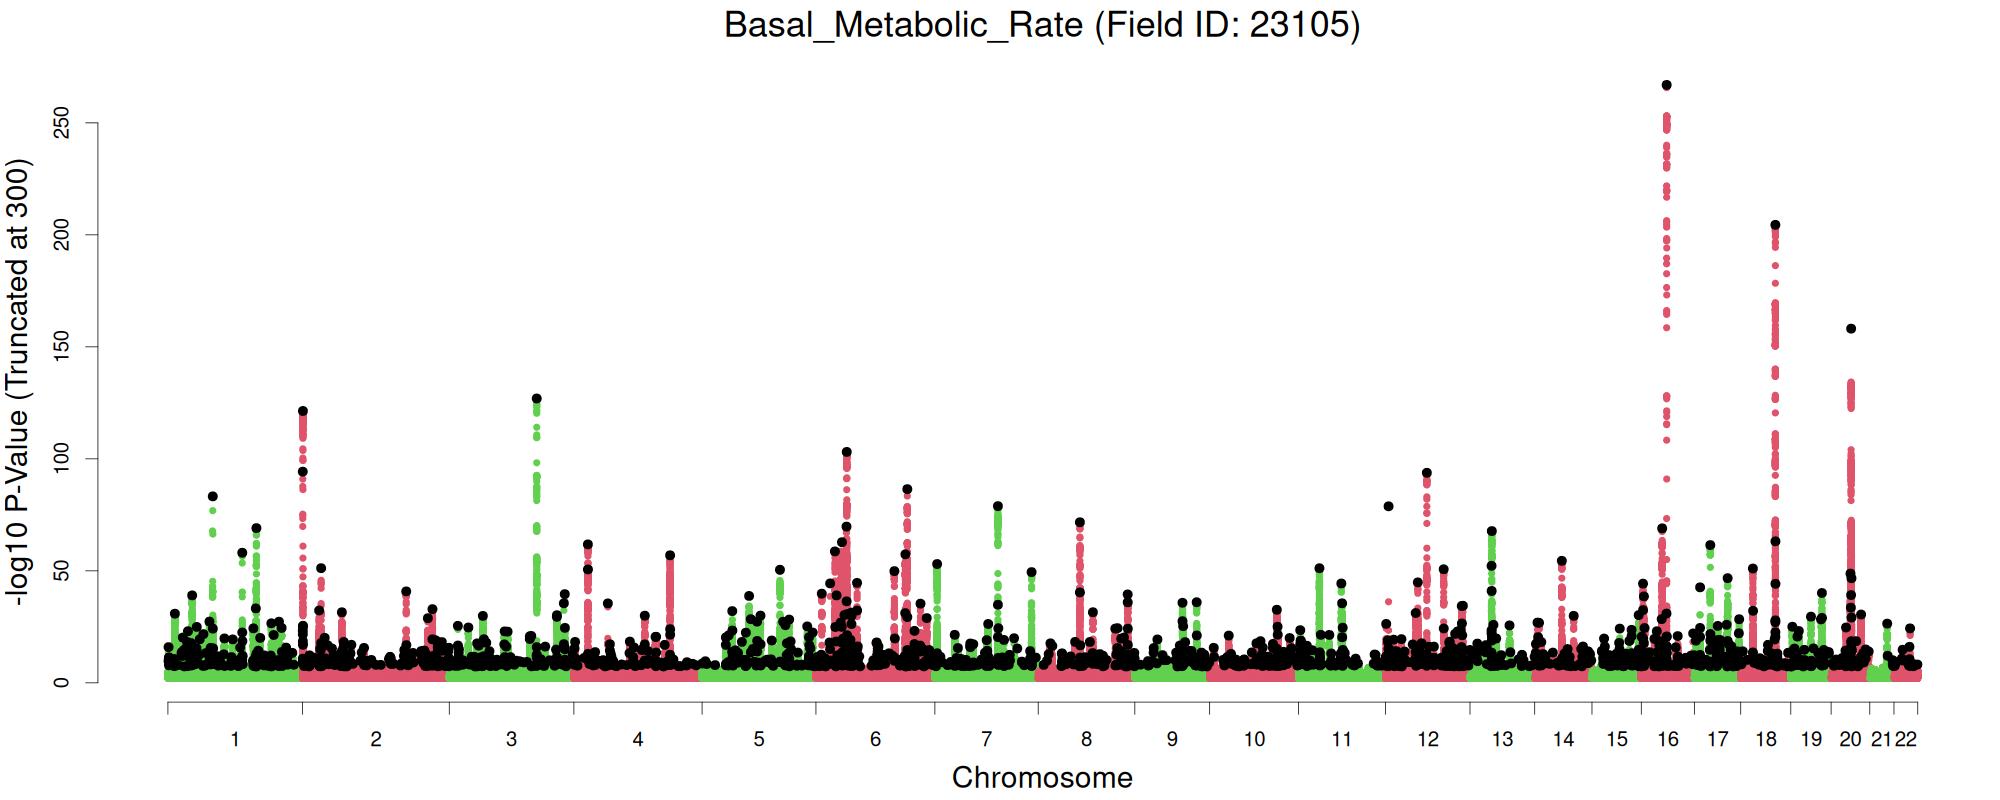
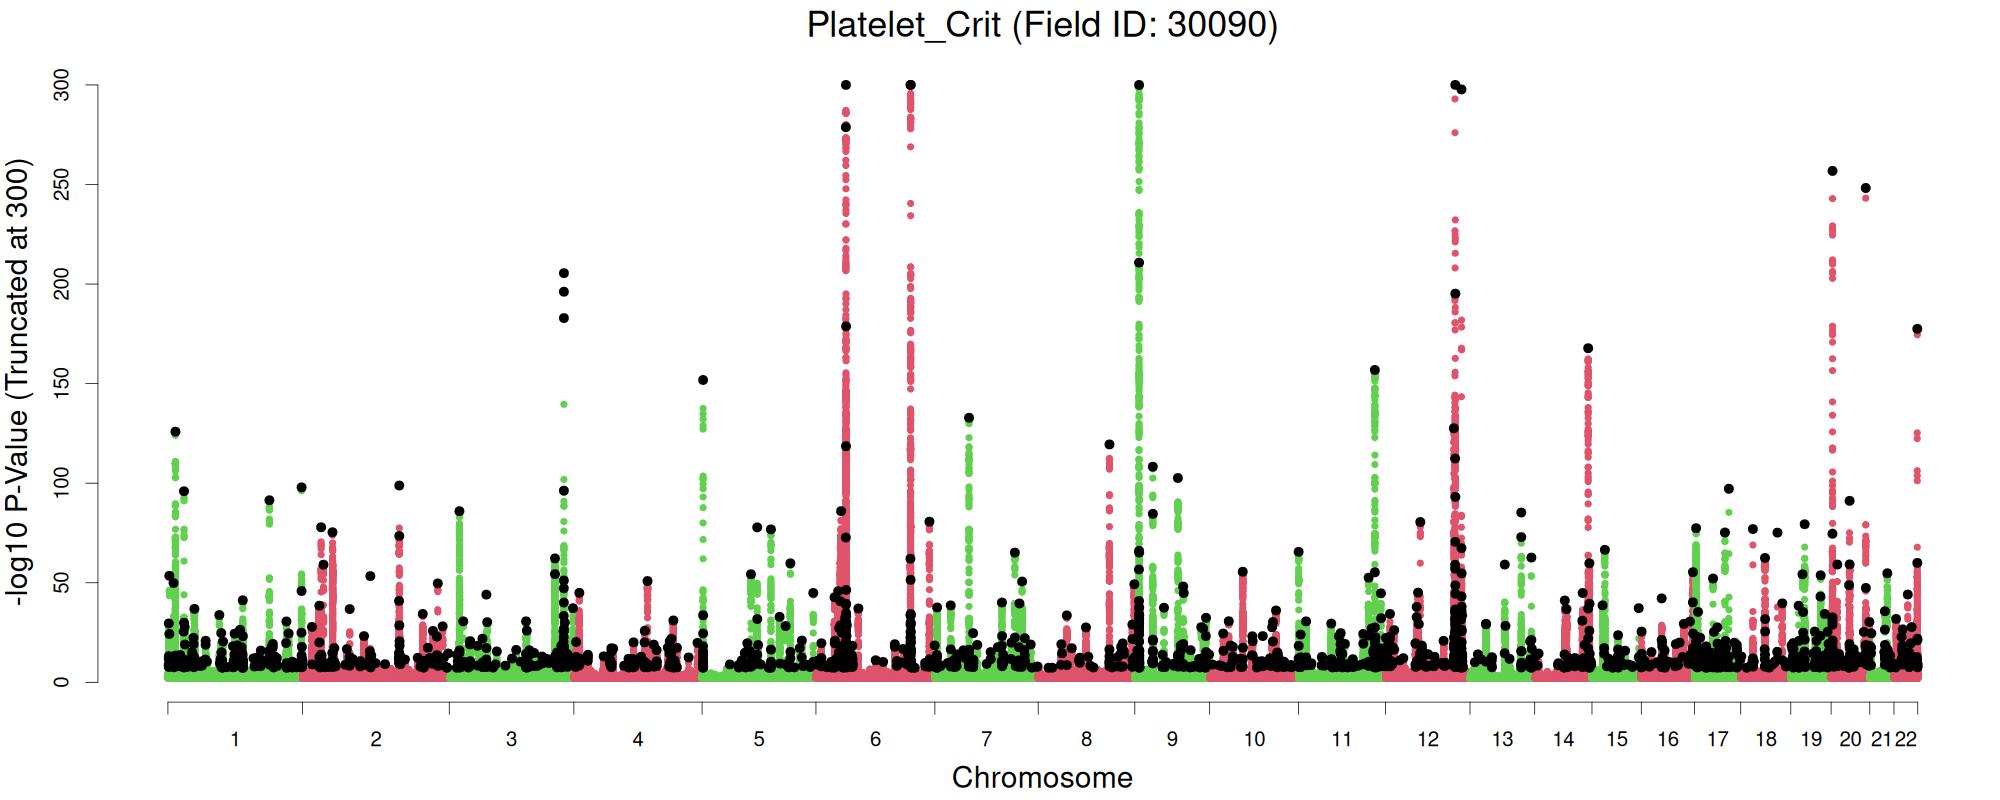
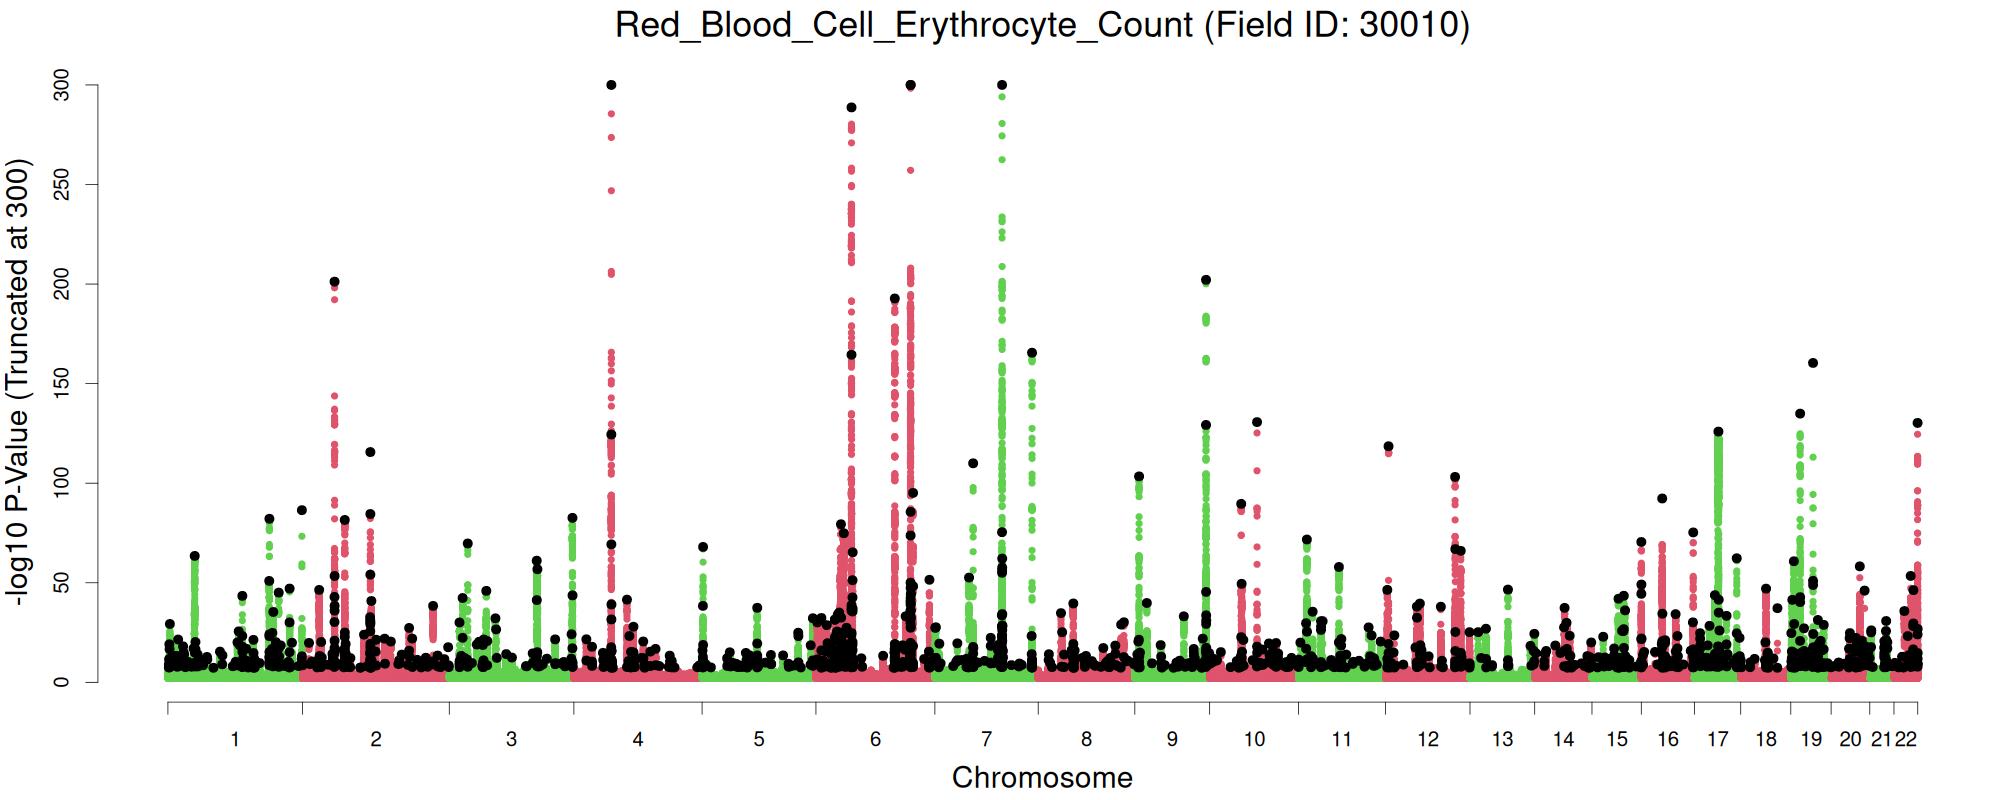
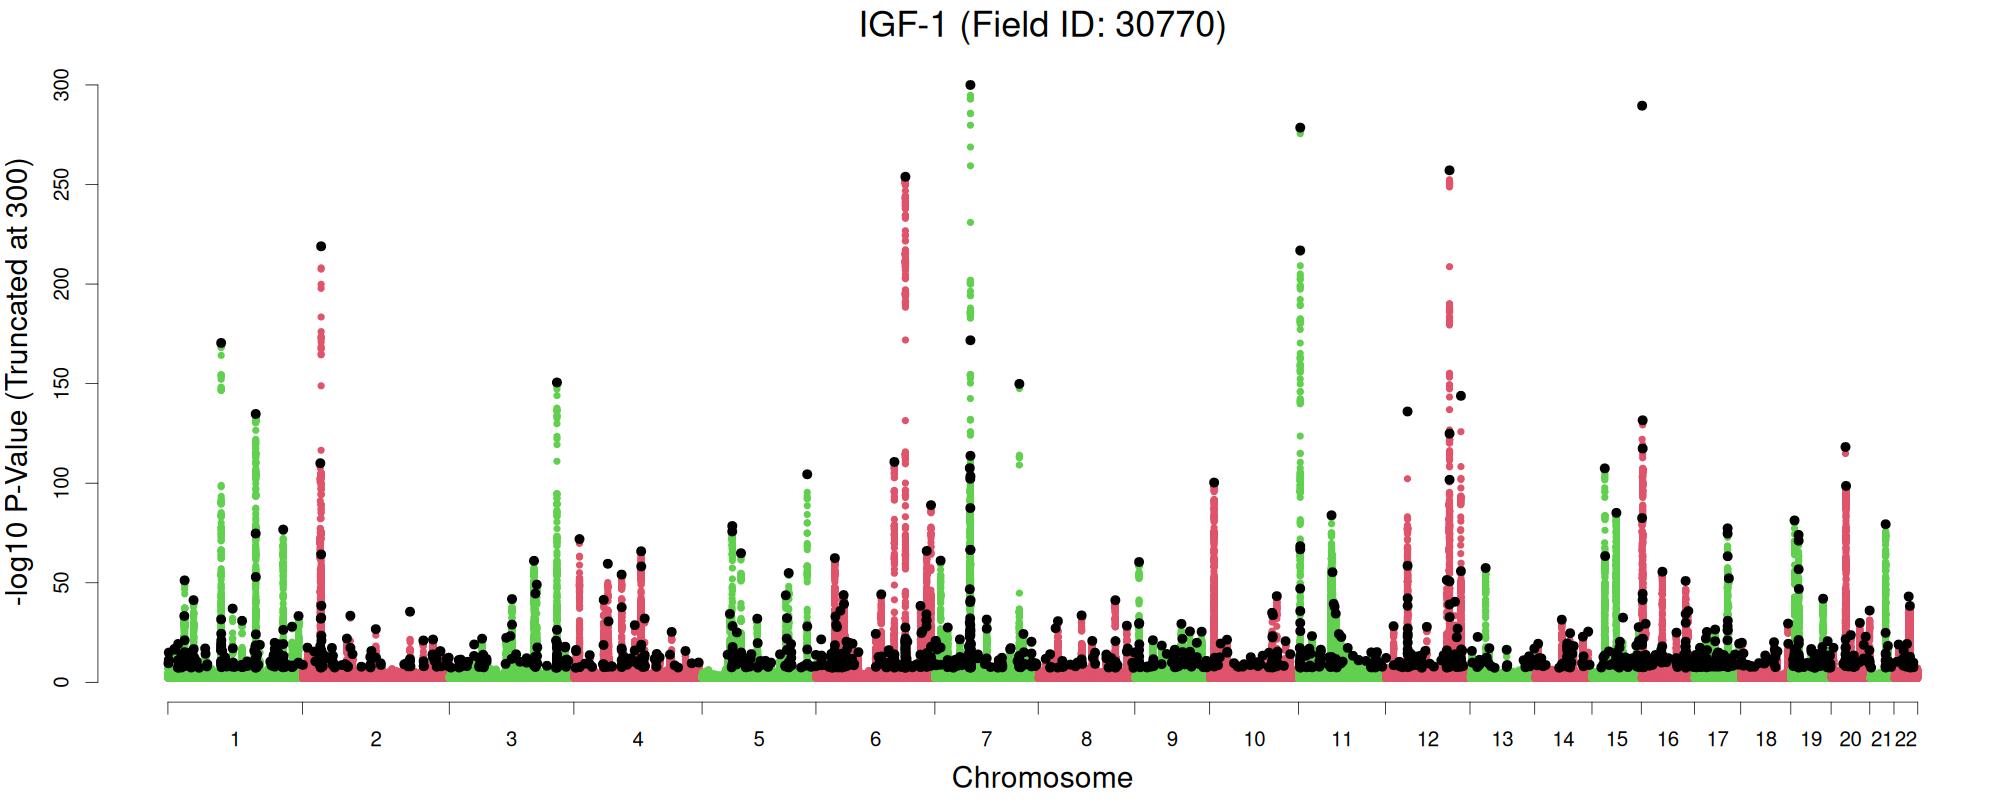
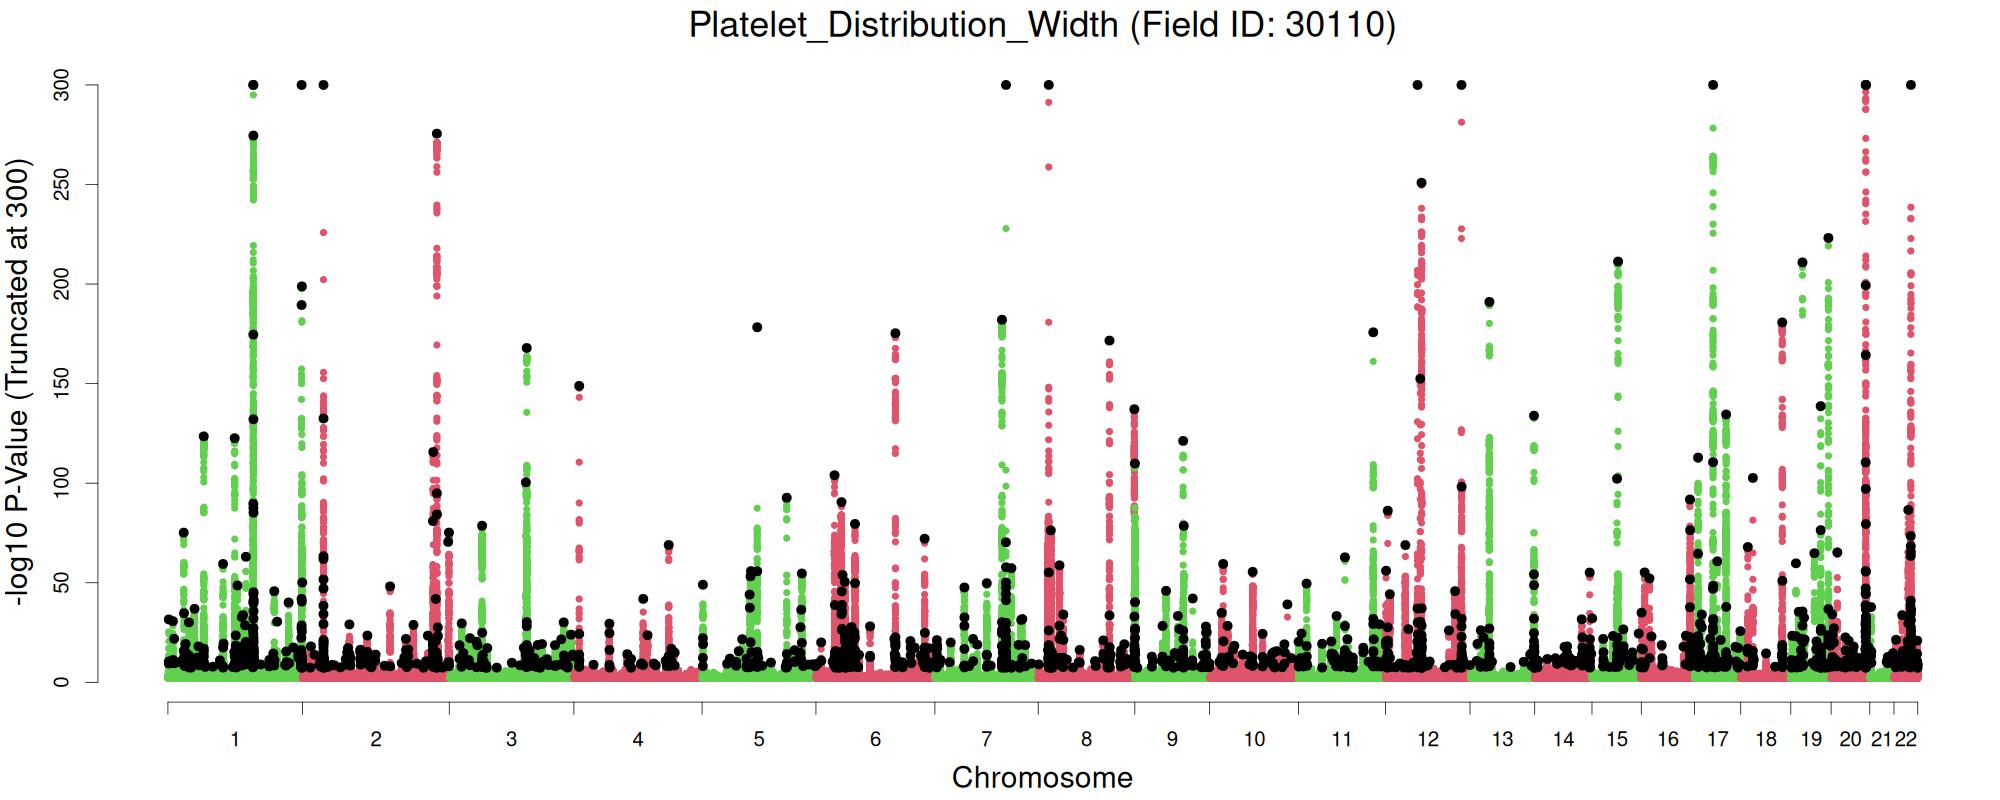
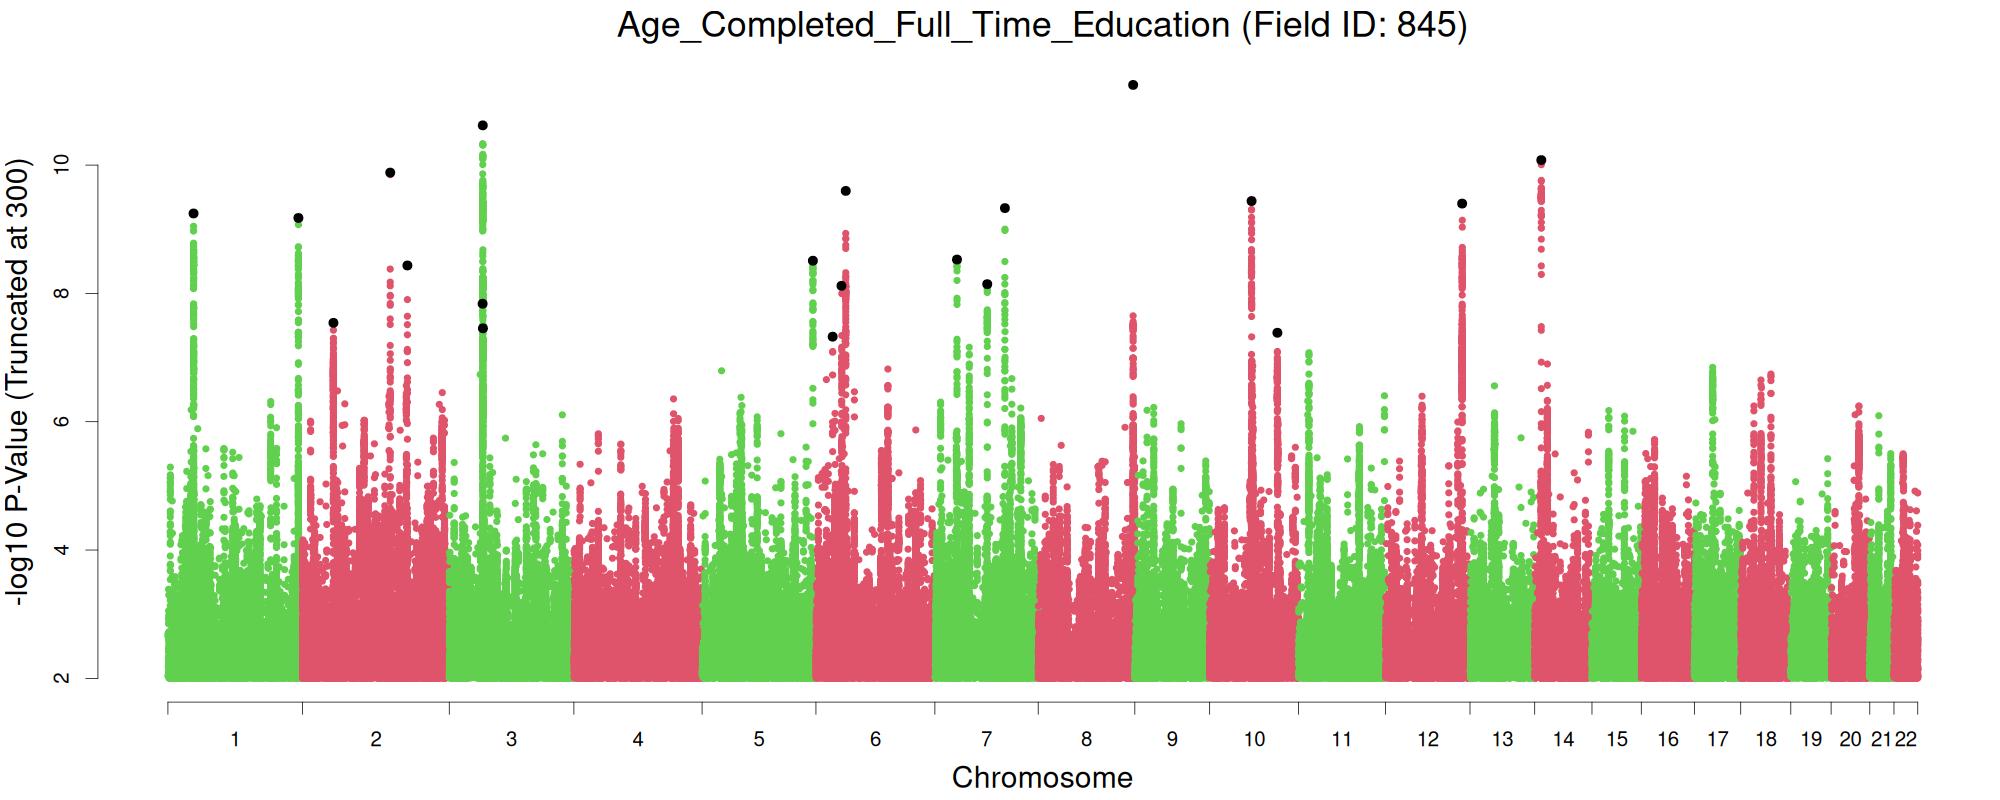
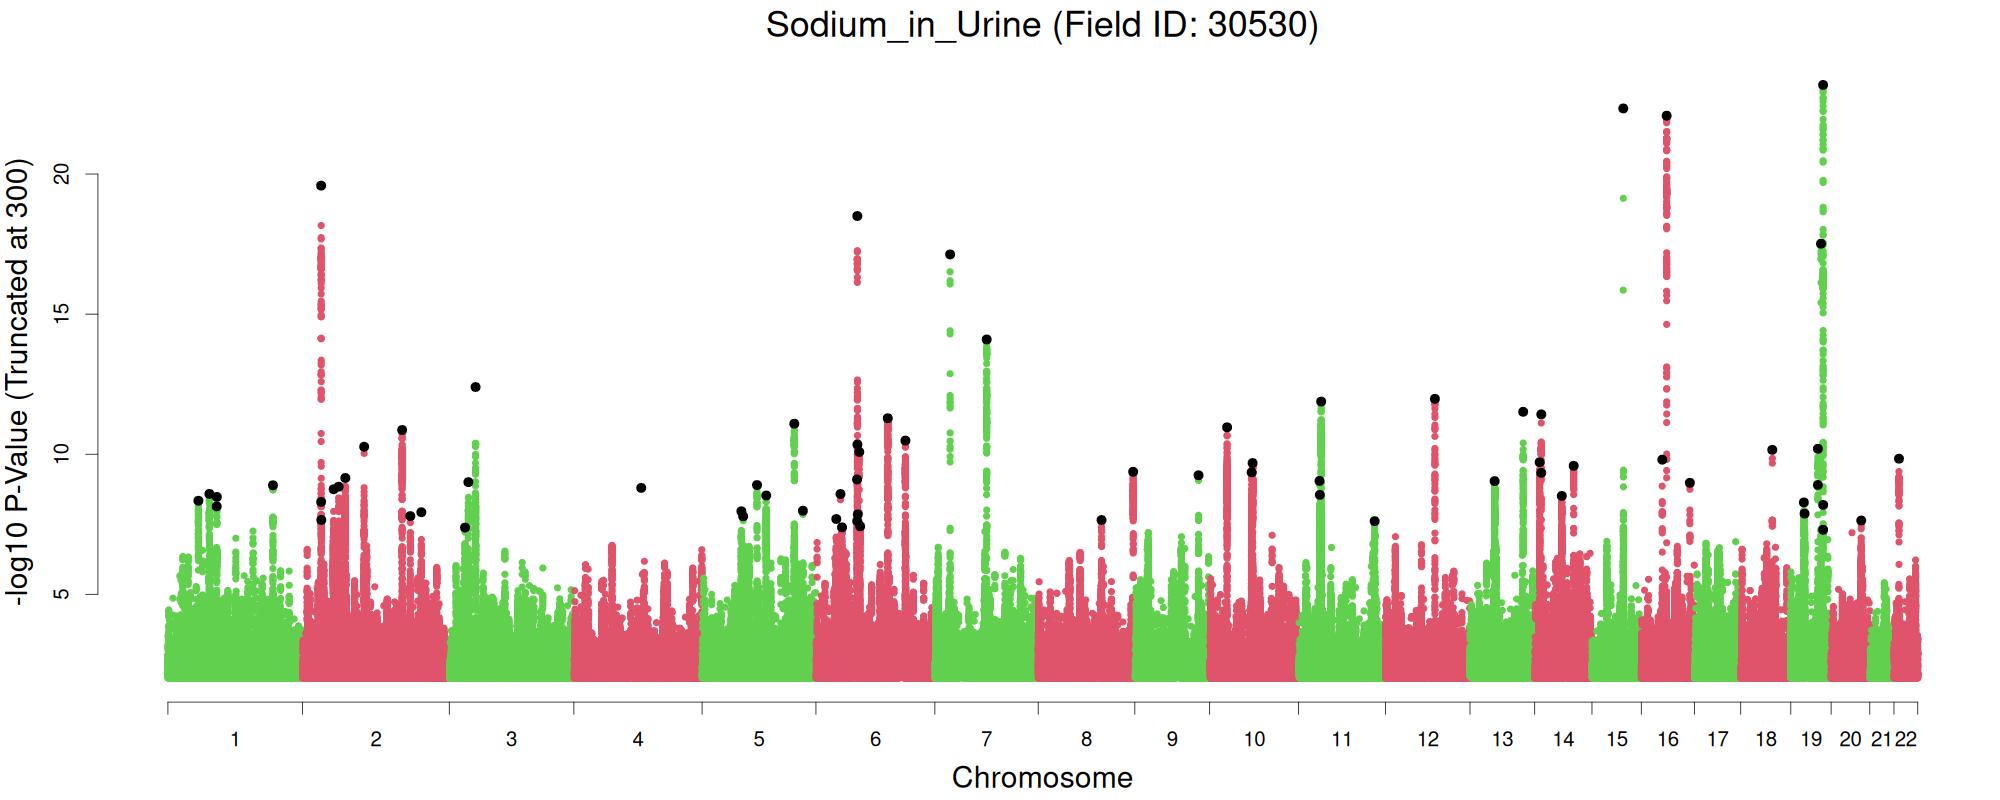
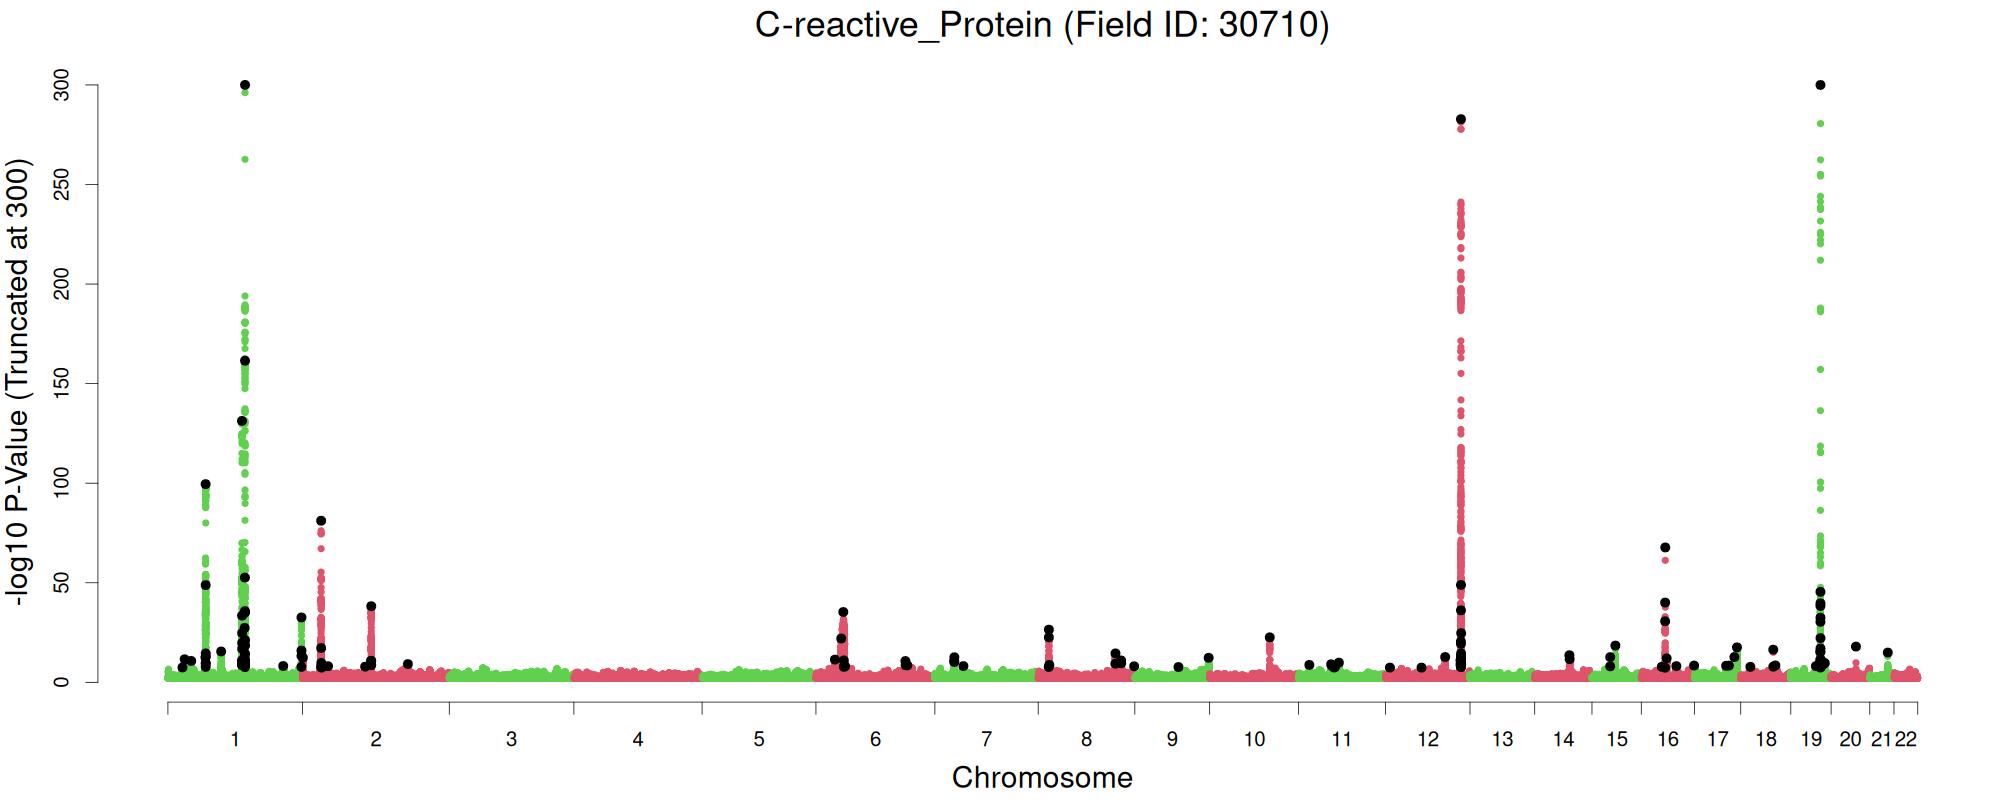
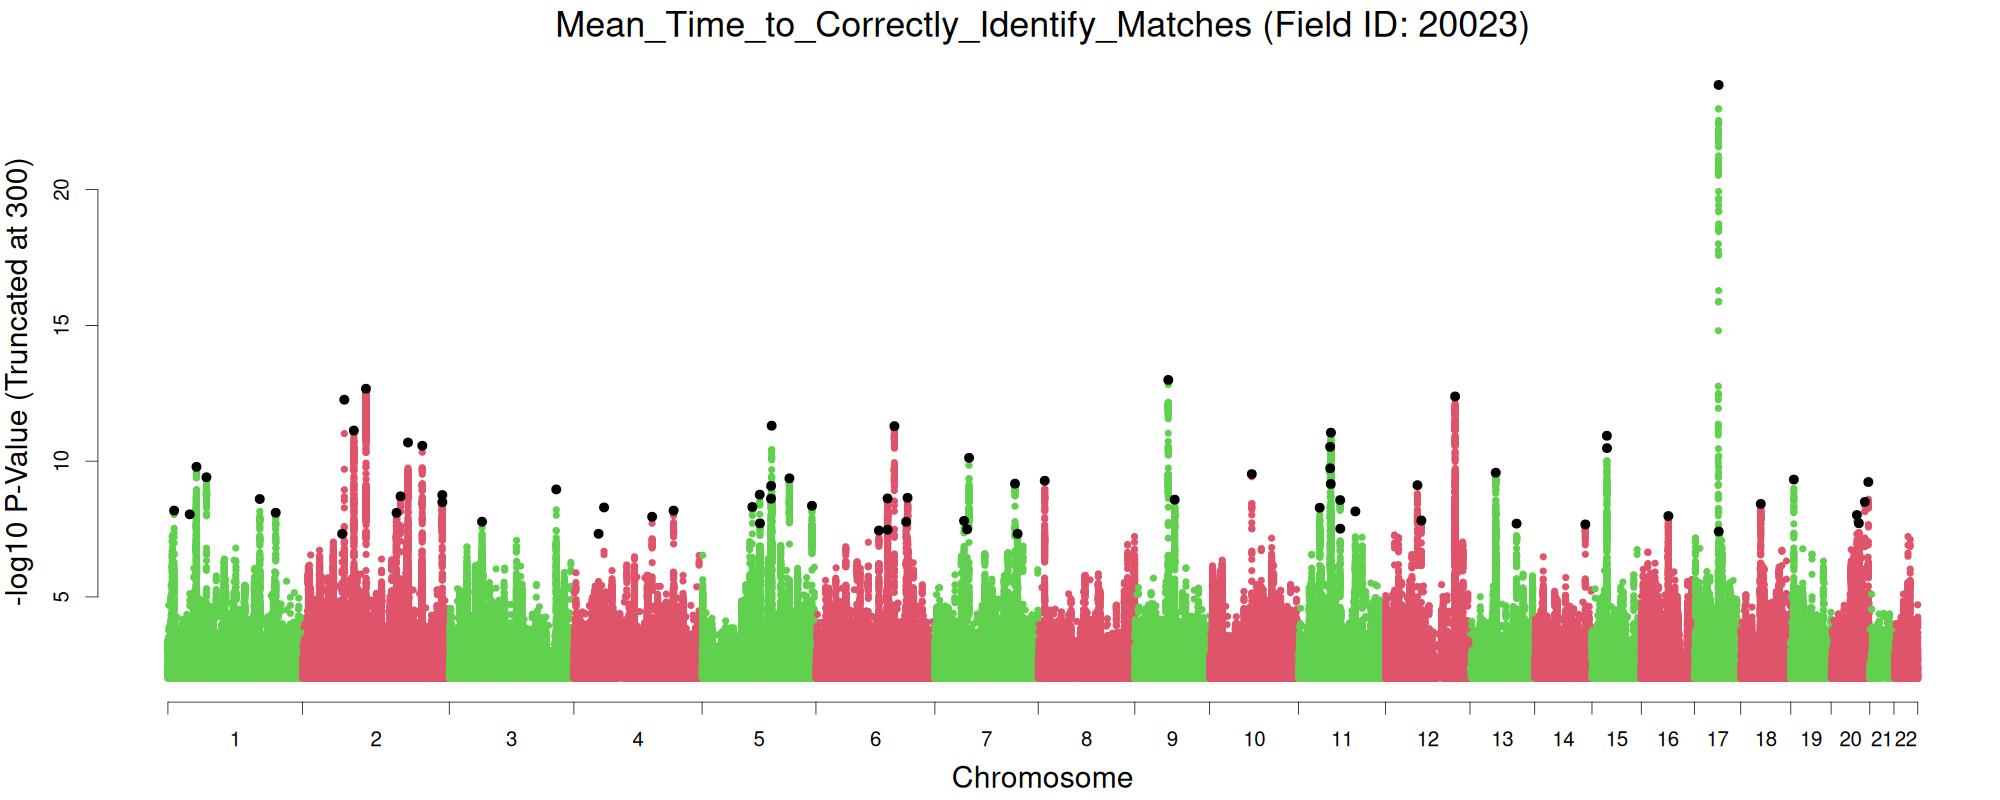
On this web page, we present the GWAS results of 62 quantitative traits from the UK Biobank using LDAK-KVIK.
| Index | Name | Field_ID | Sample_Size | h2_SNP | Num_Sig | Num_Clump | PRS_R2 | Manhattan | Summary_Stats | PGS_Weights |
|---|---|---|---|---|---|---|---|---|---|---|
| 1 | Standing Height | 50 | 458079 | 0.668 | 386876 | 5256 | 0.417 | Manhattan | Summary Stats | PGS Weights |
| 2 | Mean Platelet Thrombocyte Volume | 30100 | 445360 | 0.486 | 203778 | 3003 | 0.369 | Manhattan | Summary Stats | PGS Weights |
| 3 | Platelet Count | 30080 | 445365 | 0.405 | 156457 | 2226 | 0.247 | Manhattan | Summary Stats | PGS Weights |
| 4 | Basal Metabolic Rate | 23105 | 451092 | 0.365 | 139234 | 1835 | 0.196 | Manhattan | Summary Stats | PGS Weights |
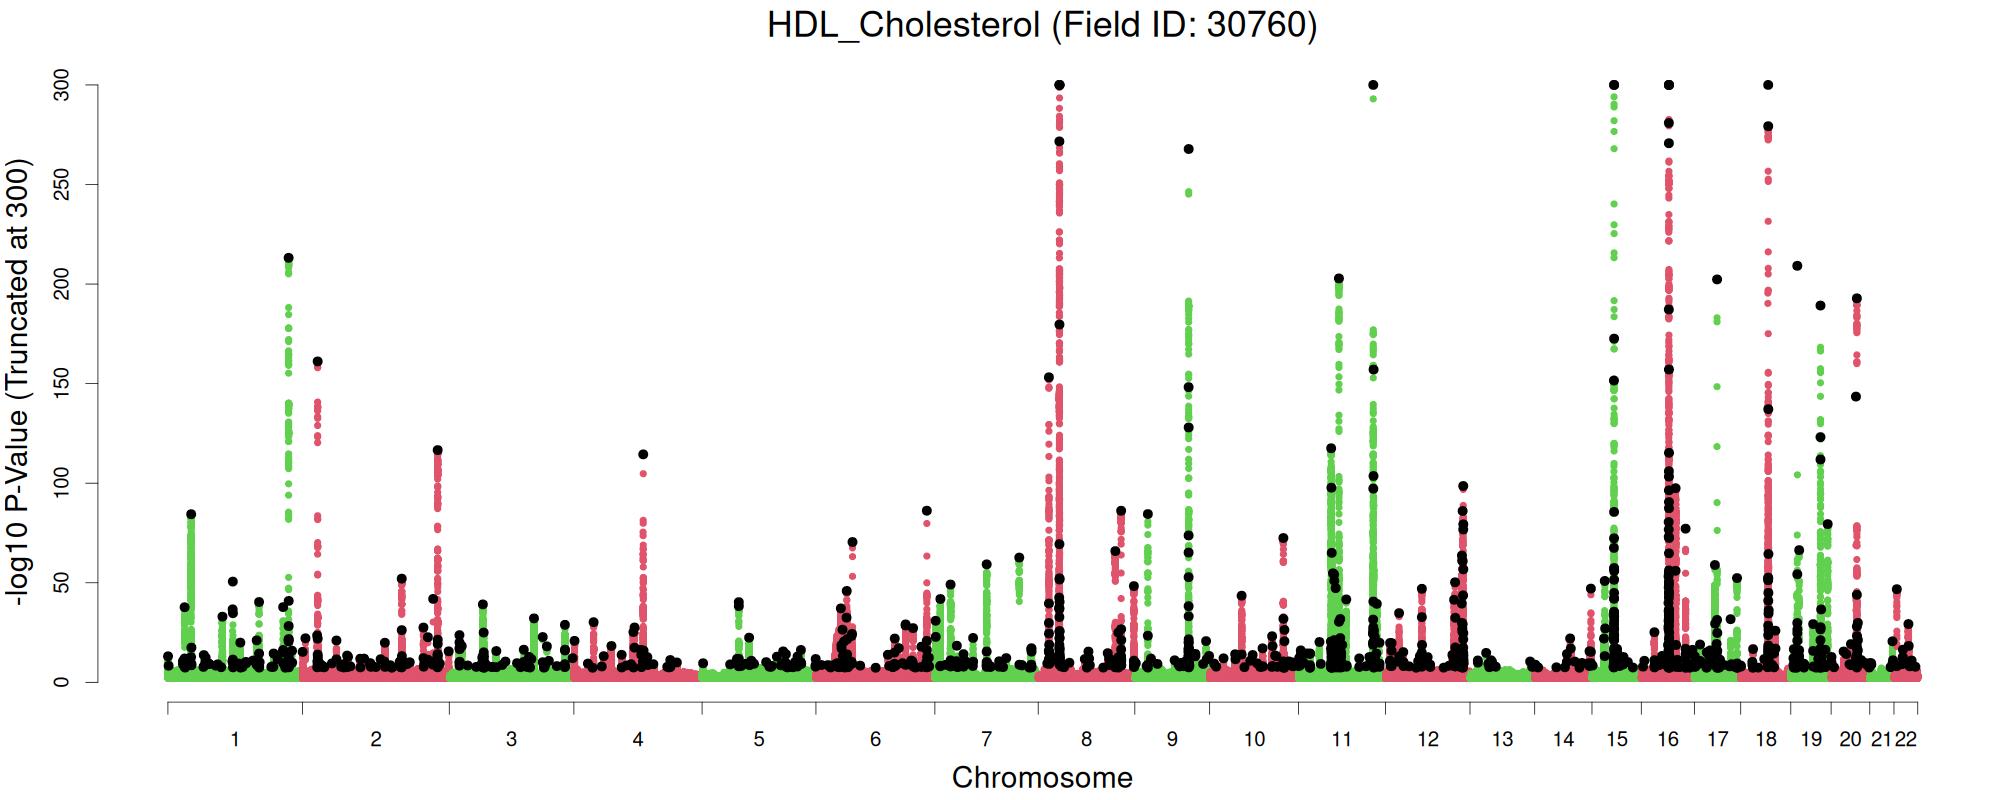
| 5 | HDL Cholesterol | 30760 | 400615 | 0.356 | 84921 | 1262 | 0.222 | Manhattan | Summary Stats | PGS Weights |
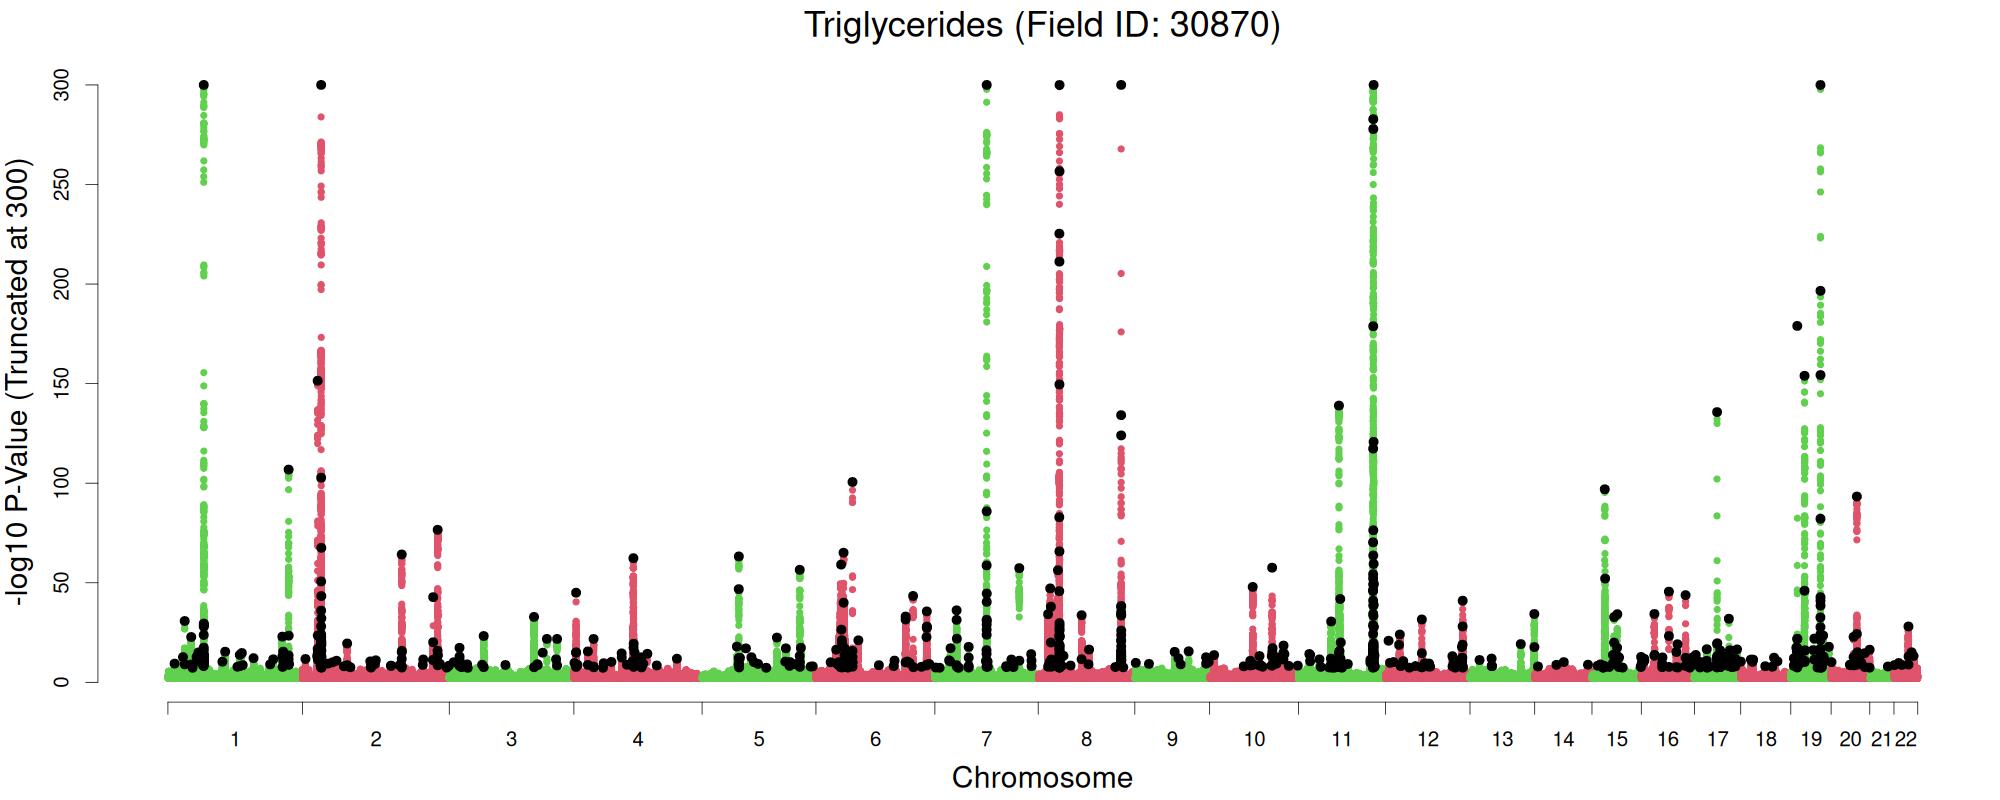
| 6 | Triglycerides | 30870 | 437378 | 0.331 | 61474 | 790 | 0.133 | Manhattan | Summary Stats | PGS Weights |
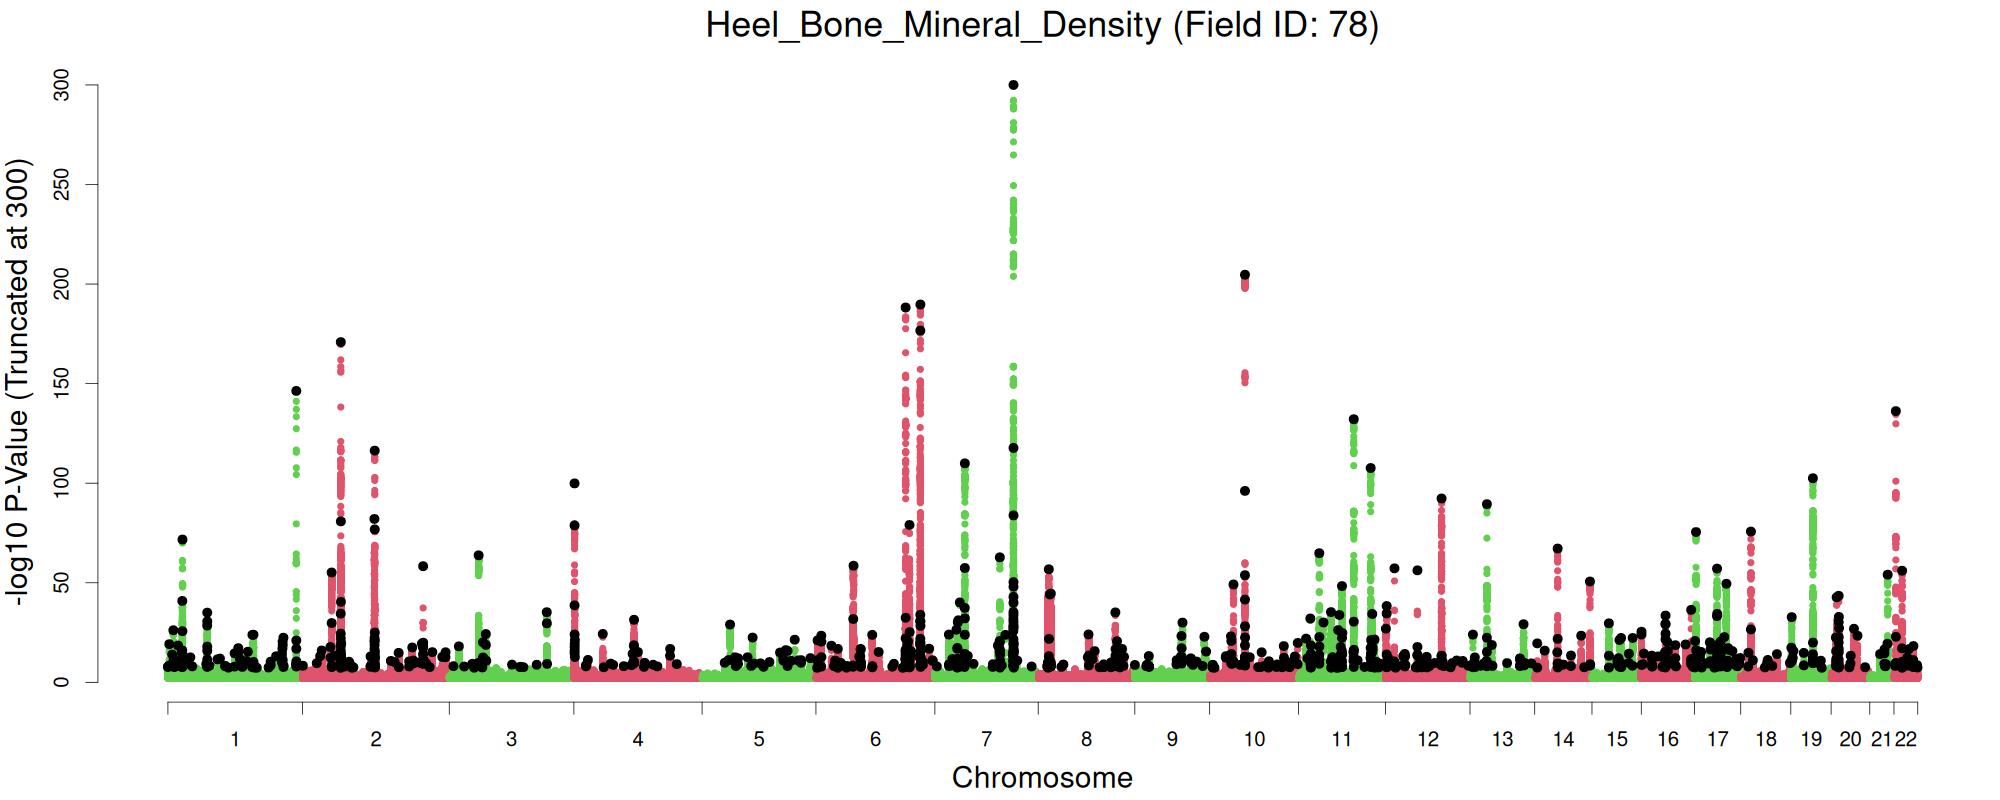
| 7 | Heel Bone Mineral Density | 78 | 263839 | 0.33 | 68461 | 952 | 0.186 | Manhattan | Summary Stats | PGS Weights |
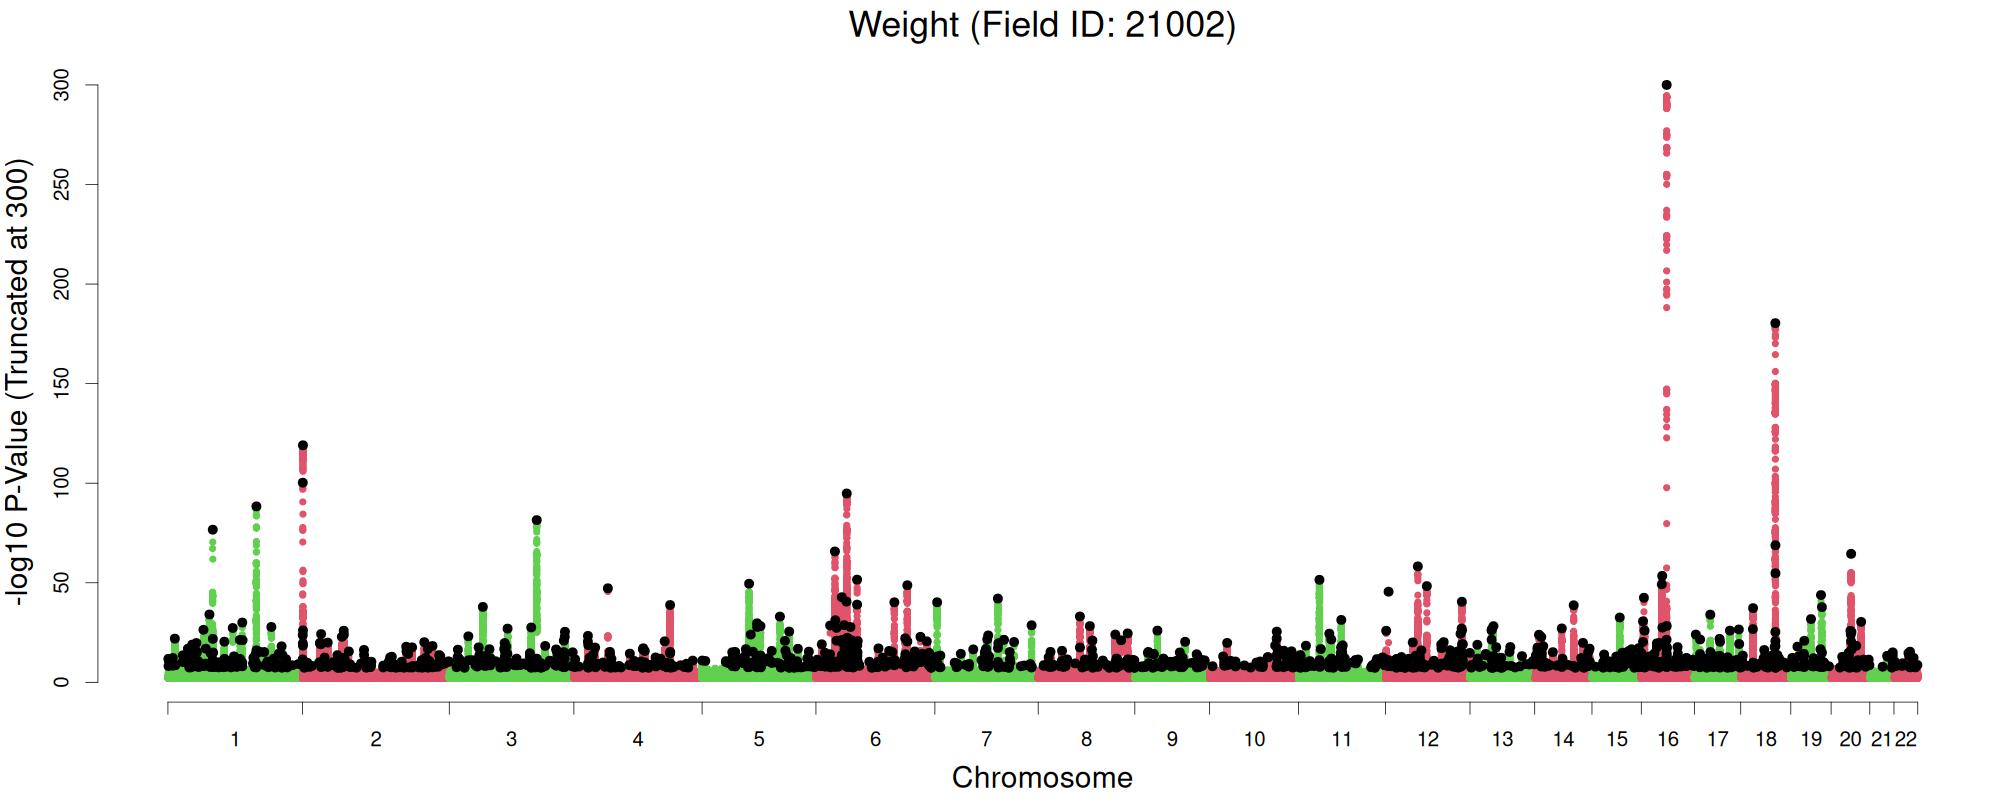
| 8 | Weight | 21002 | 457761 | 0.33 | 113836 | 1437 | 0.171 | Manhattan | Summary Stats | PGS Weights |
| 9 | Platelet Crit | 30090 | 445361 | 0.327 | 116930 | 1739 | 0.197 | Manhattan | Summary Stats | PGS Weights |
| 10 | Red Blood Cell Erythrocyte Count | 30010 | 445368 | 0.317 | 115727 | 1540 | 0.176 | Manhattan | Summary Stats | PGS Weights |
| 11 | IGF-1 | 30770 | 435364 | 0.31 | 133251 | 1434 | 0.17 | Manhattan | Summary Stats | PGS Weights |
| 12 | Platelet Distribution Width | 30110 | 445360 | 0.309 | 125777 | 1715 | 0.231 | Manhattan | Summary Stats | PGS Weights |
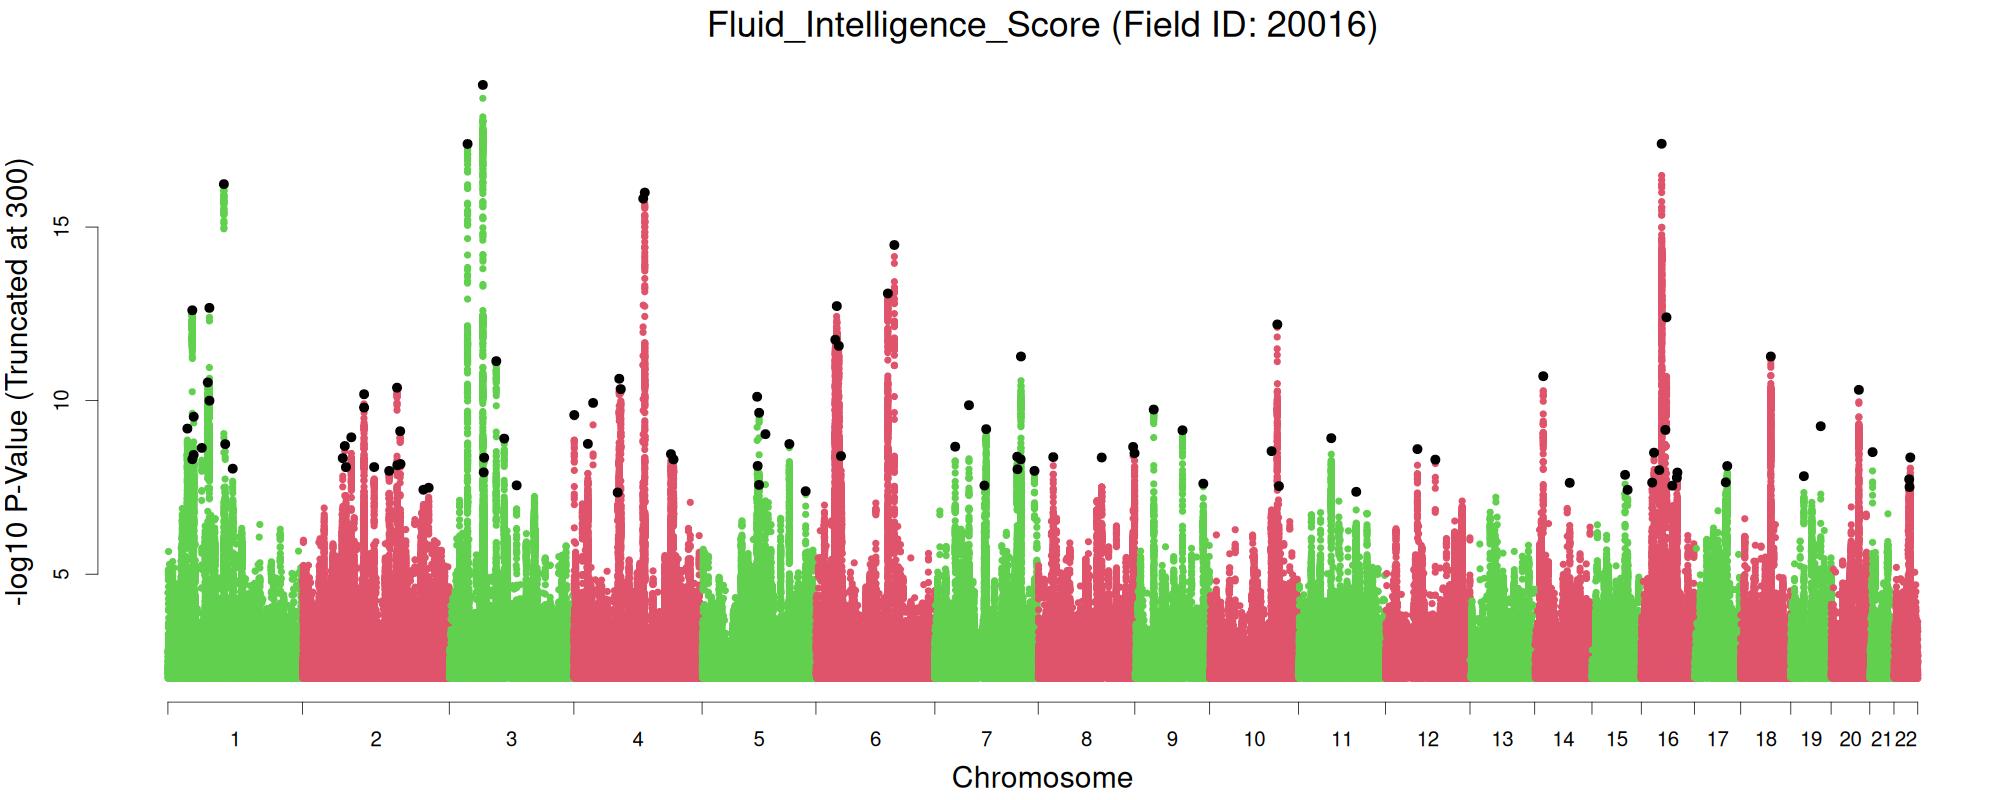
| 13 | Fluid Intelligence Score | 20016 | 147751 | 0.307 | 6946 | 98 | 0.08 | Manhattan | Summary Stats | PGS Weights |
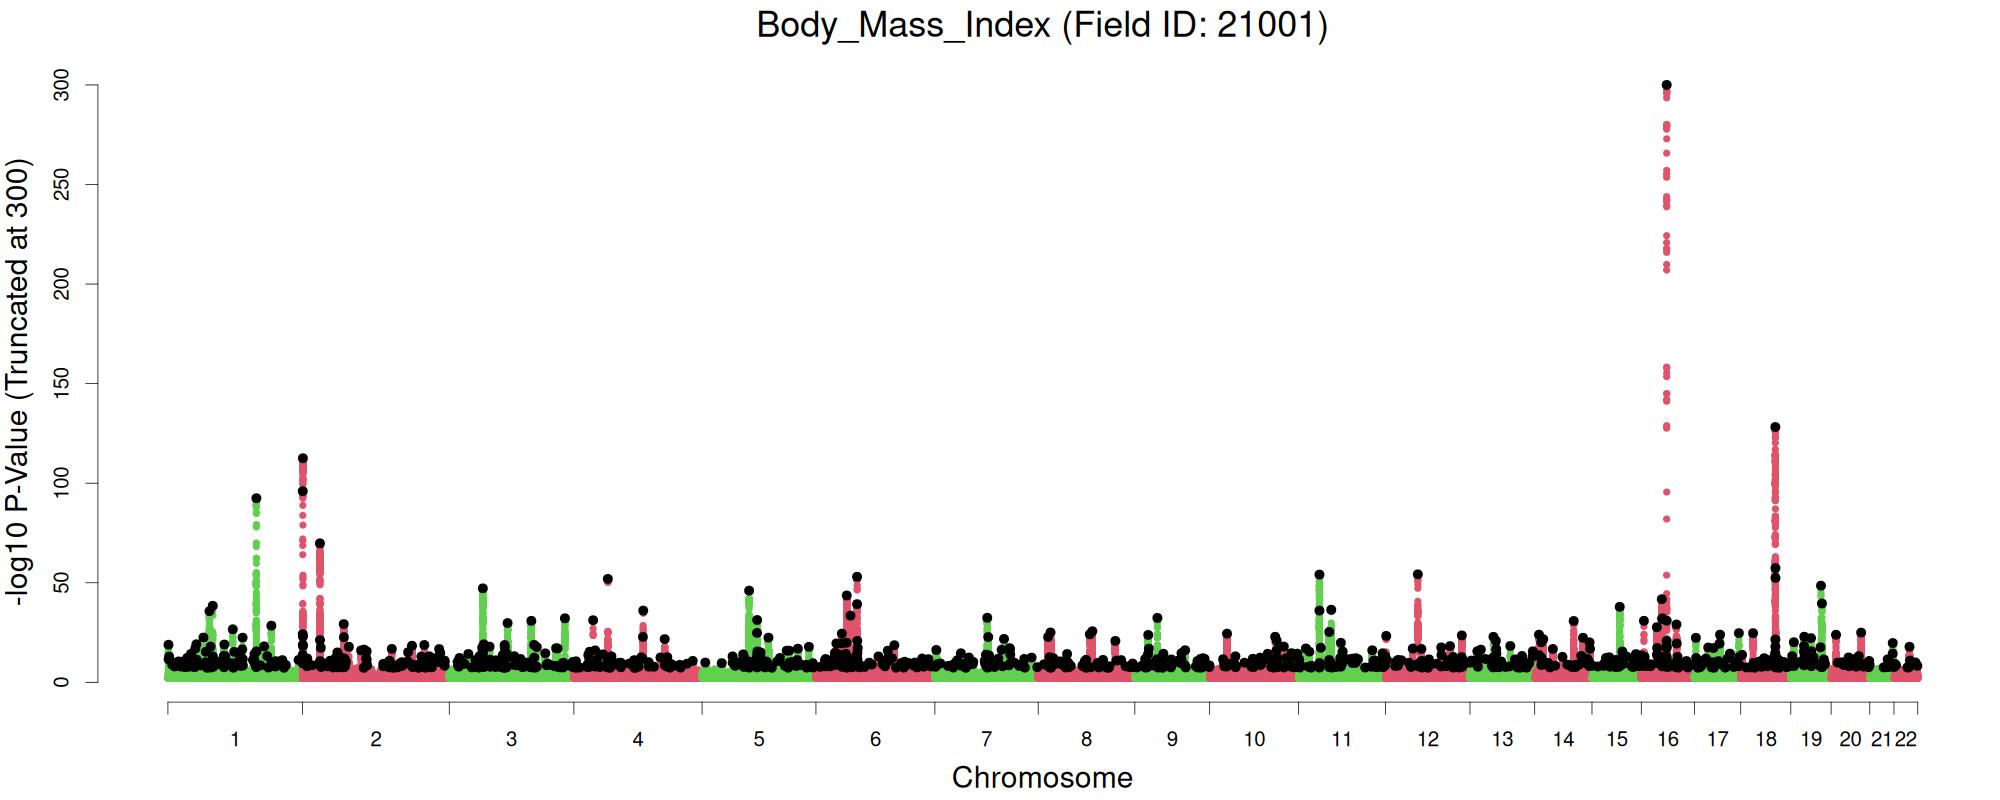
| 14 | Body Mass Index | 21001 | 457596 | 0.304 | 91976 | 1179 | 0.154 | Manhattan | Summary Stats | PGS Weights |
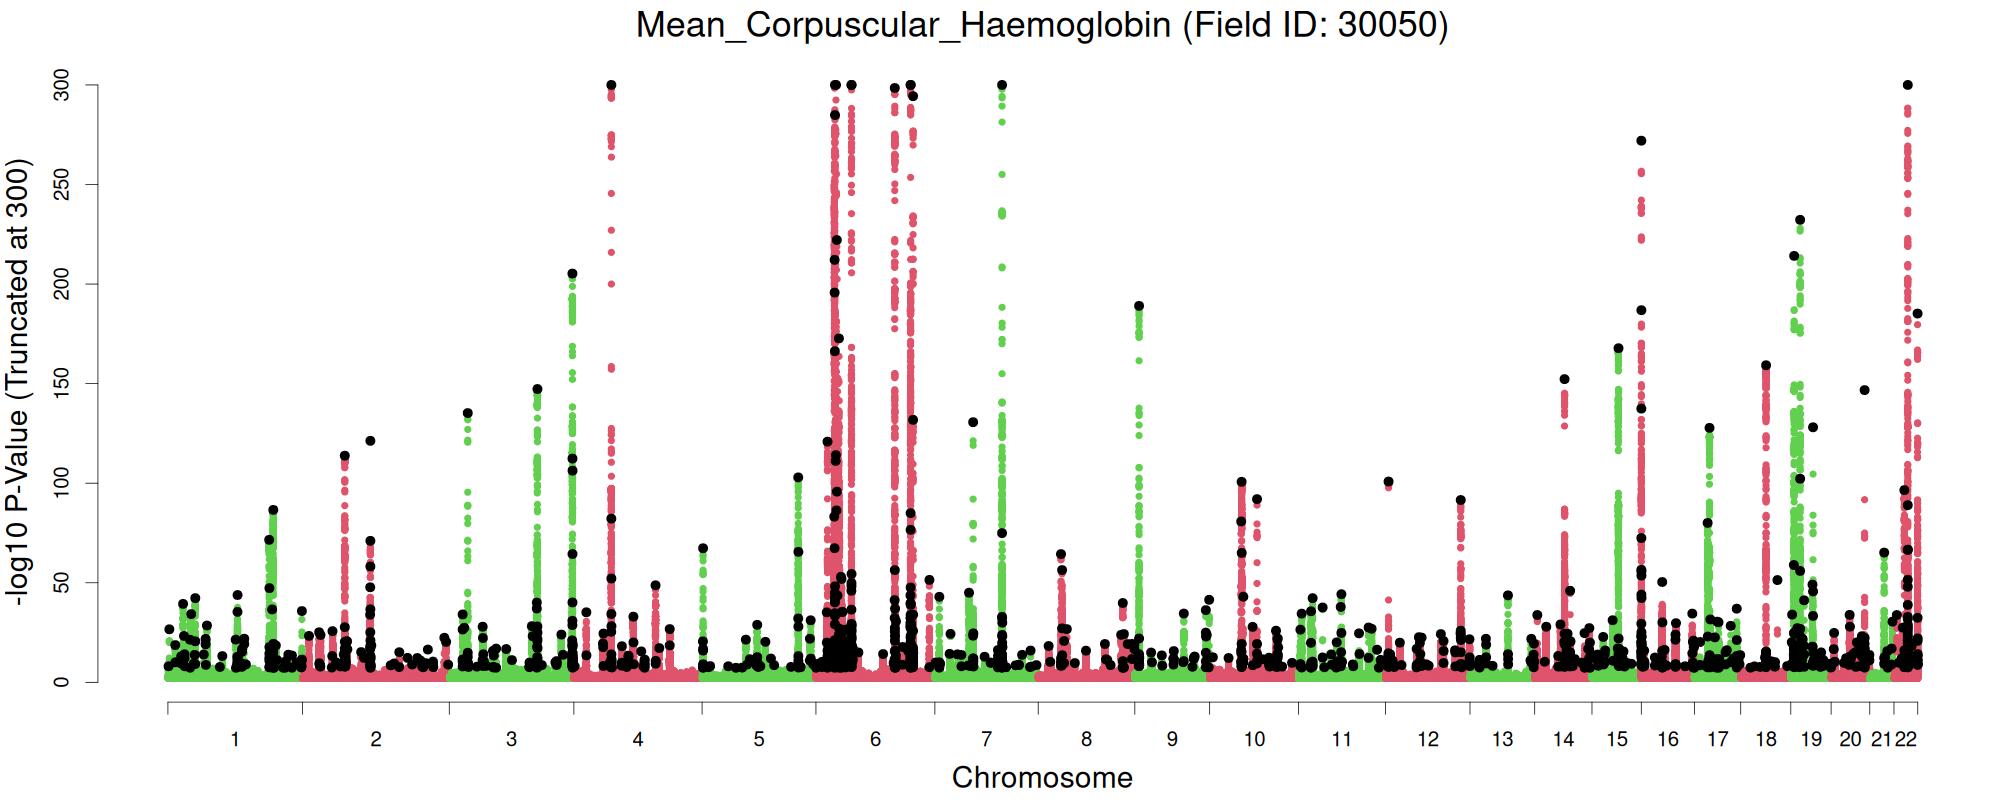
| 15 | Mean Corpuscular Haemoglobin | 30050 | 445365 | 0.288 | 105492 | 1281 | 0.169 | Manhattan | Summary Stats | PGS Weights |
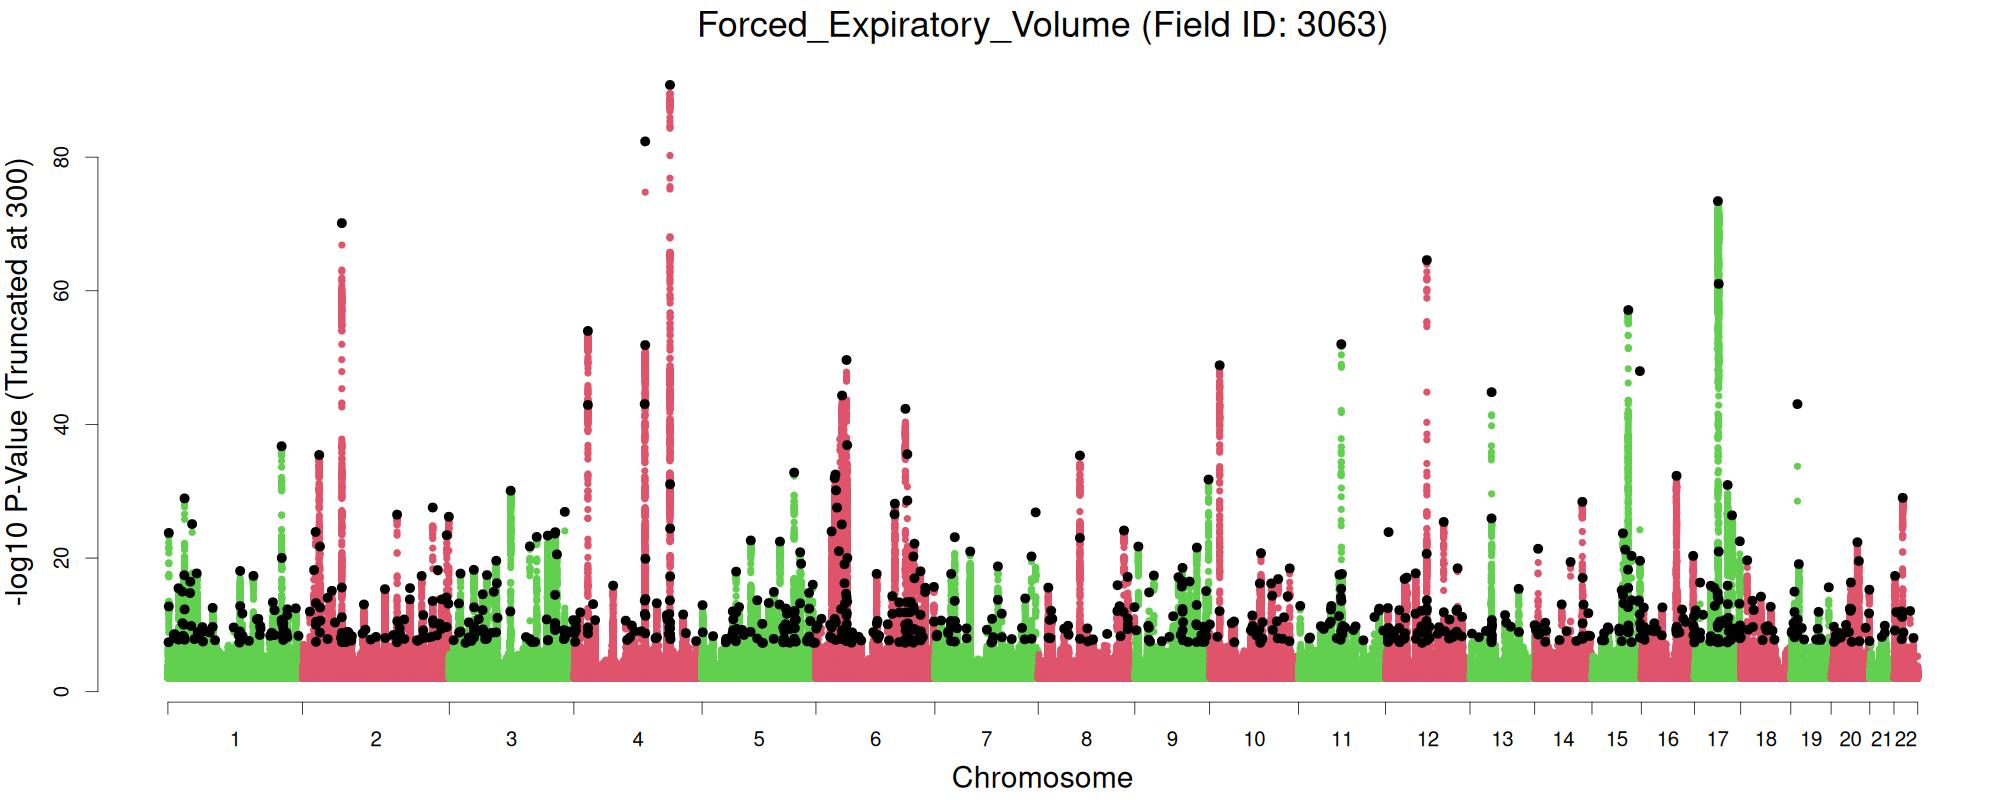
| 16 | Forced Expiratory Volume | 3063 | 418461 | 0.278 | 75190 | 842 | 0.12 | Manhattan | Summary Stats | PGS Weights |
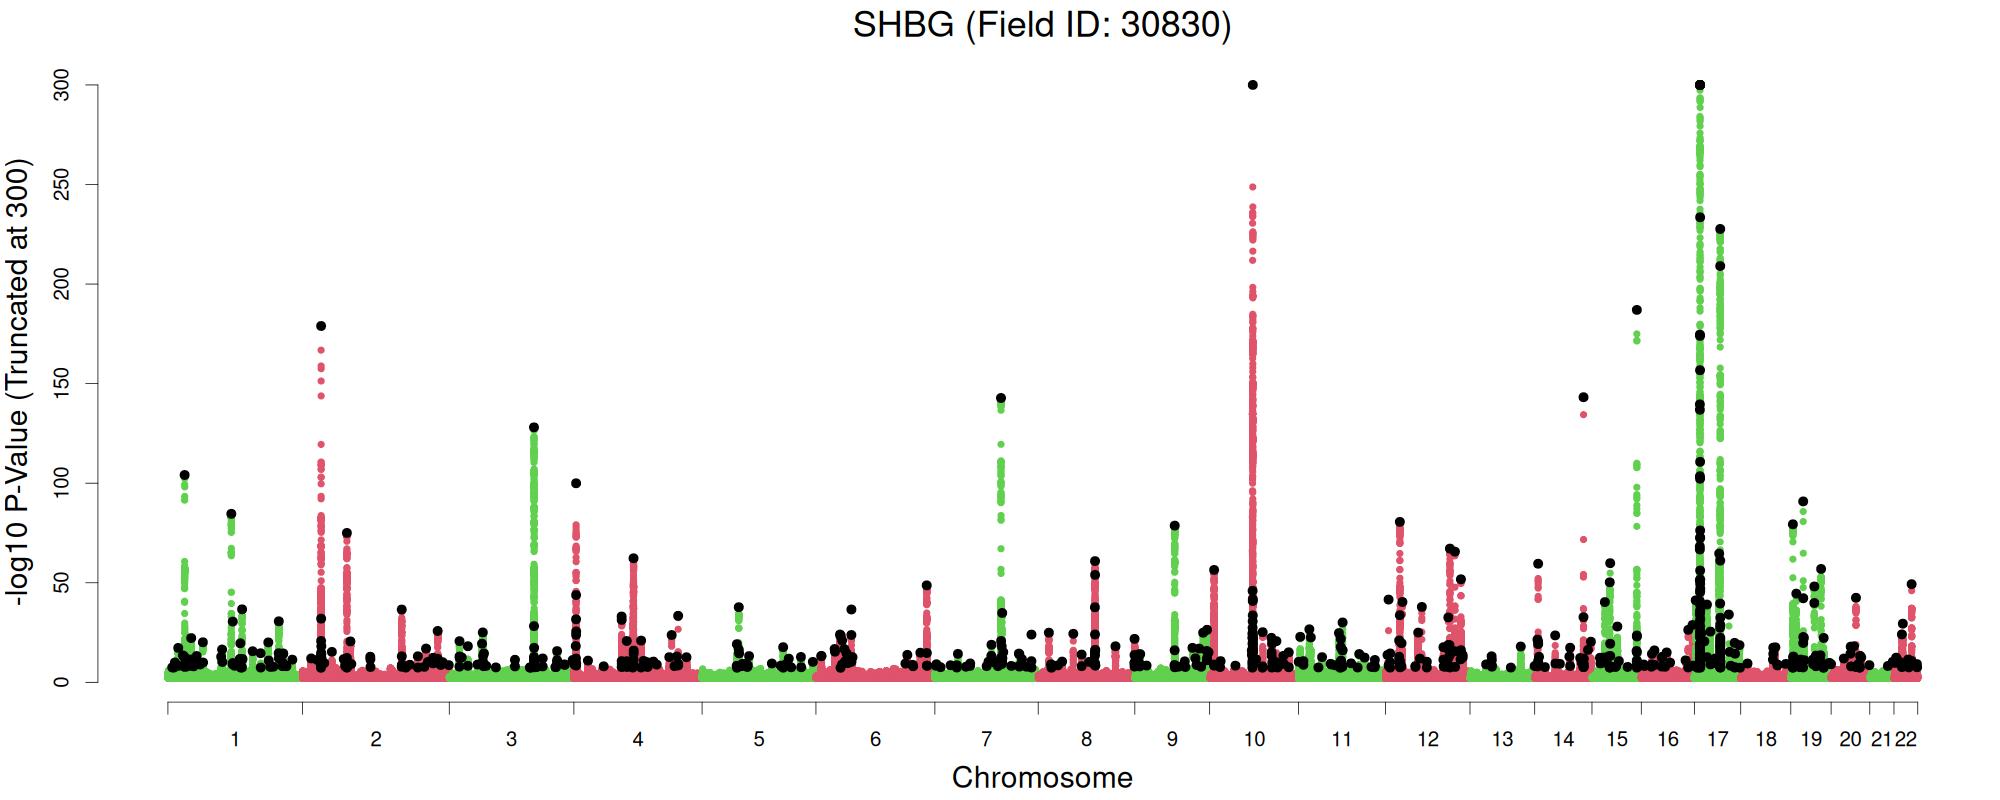
| 17 | SHBG | 30830 | 396905 | 0.274 | 56450 | 774 | 0.147 | Manhattan | Summary Stats | PGS Weights |
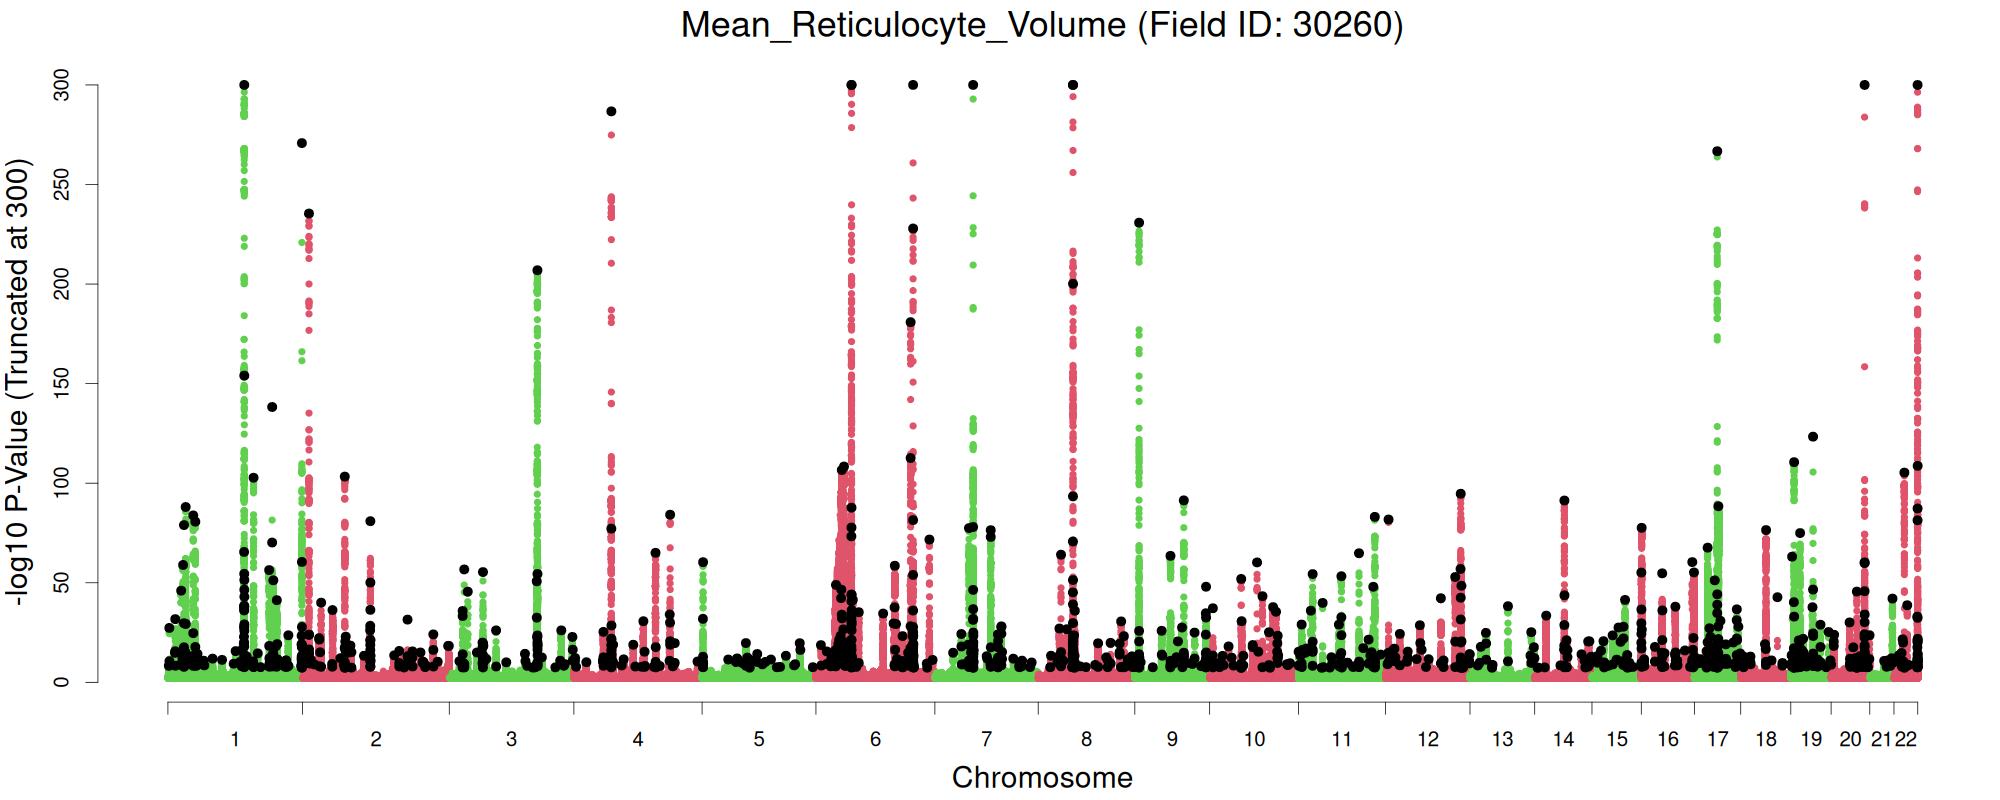
| 18 | Mean Reticulocyte Volume | 30260 | 438082 | 0.274 | 104685 | 1291 | 0.173 | Manhattan | Summary Stats | PGS Weights |
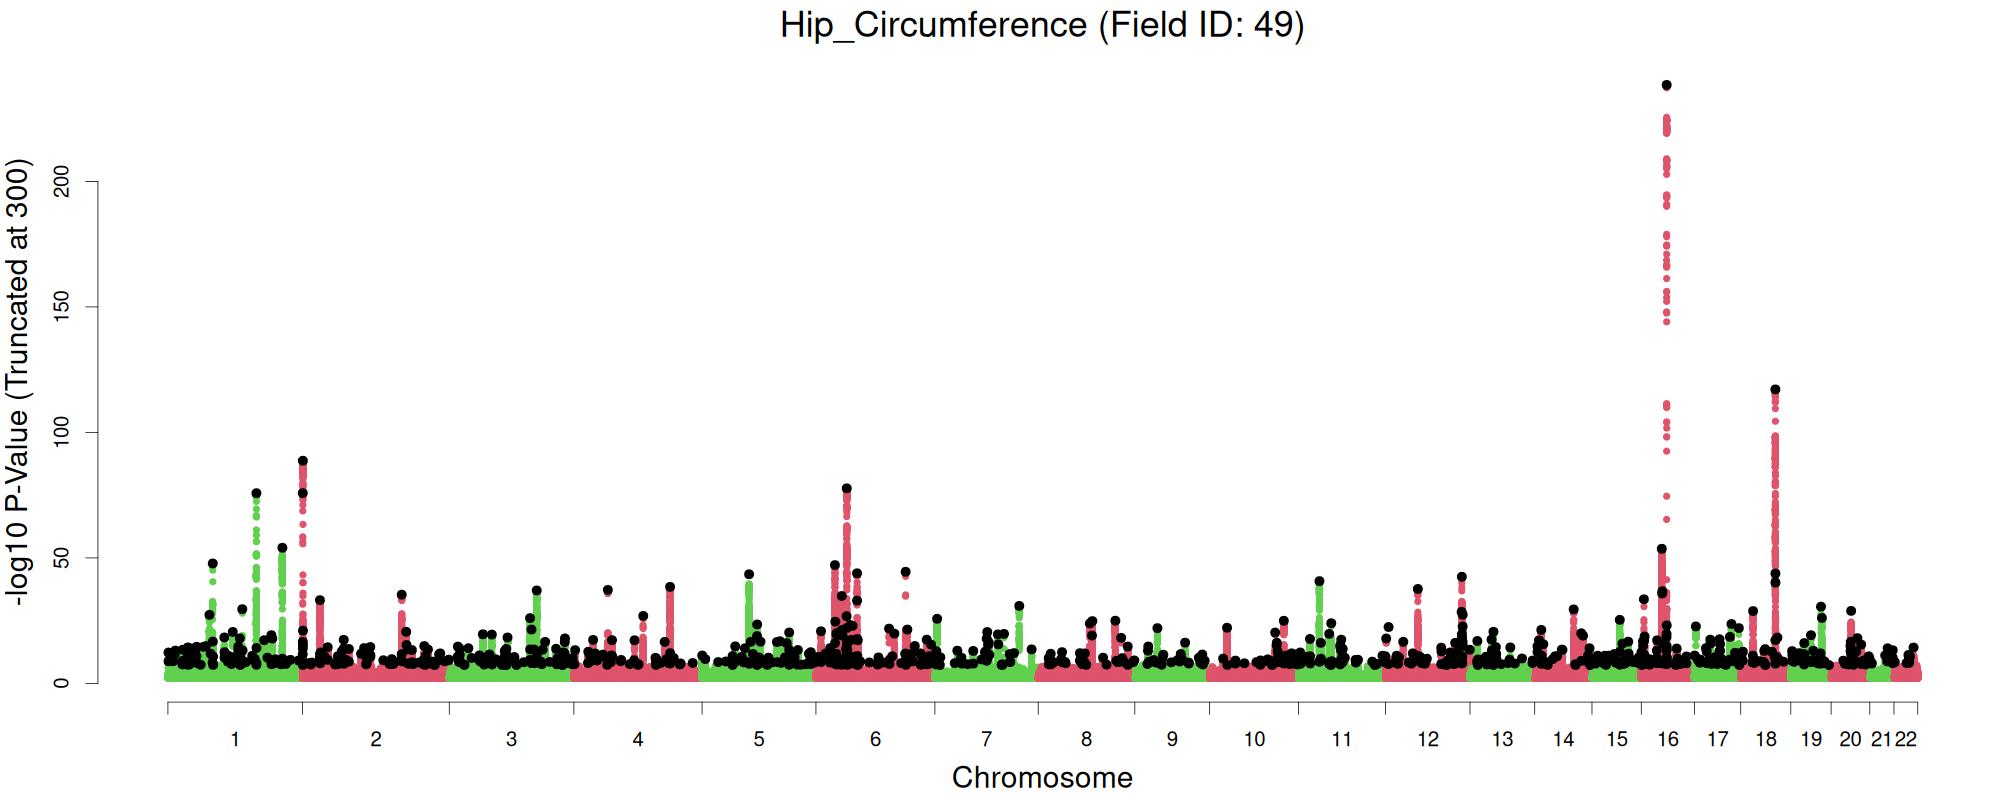
| 19 | Hip Circumference | 49 | 458243 | 0.273 | 76062 | 966 | 0.125 | Manhattan | Summary Stats | PGS Weights |
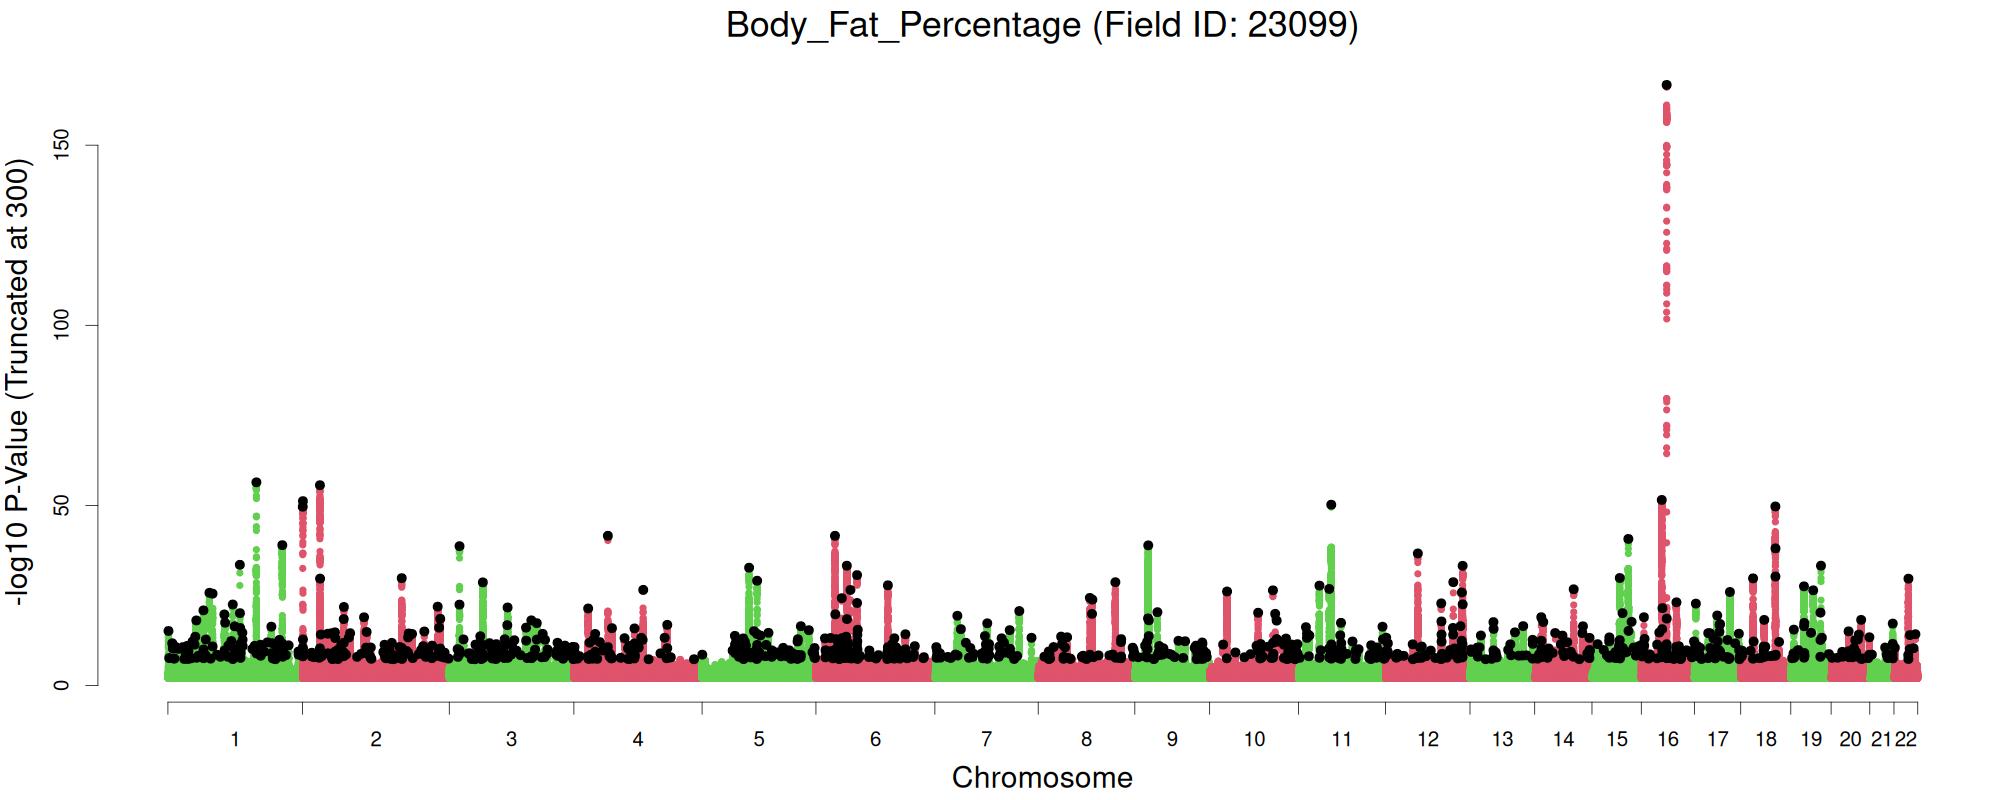
| 20 | Body Fat Percentage | 23099 | 450852 | 0.271 | 73568 | 1003 | 0.14 | Manhattan | Summary Stats | PGS Weights |
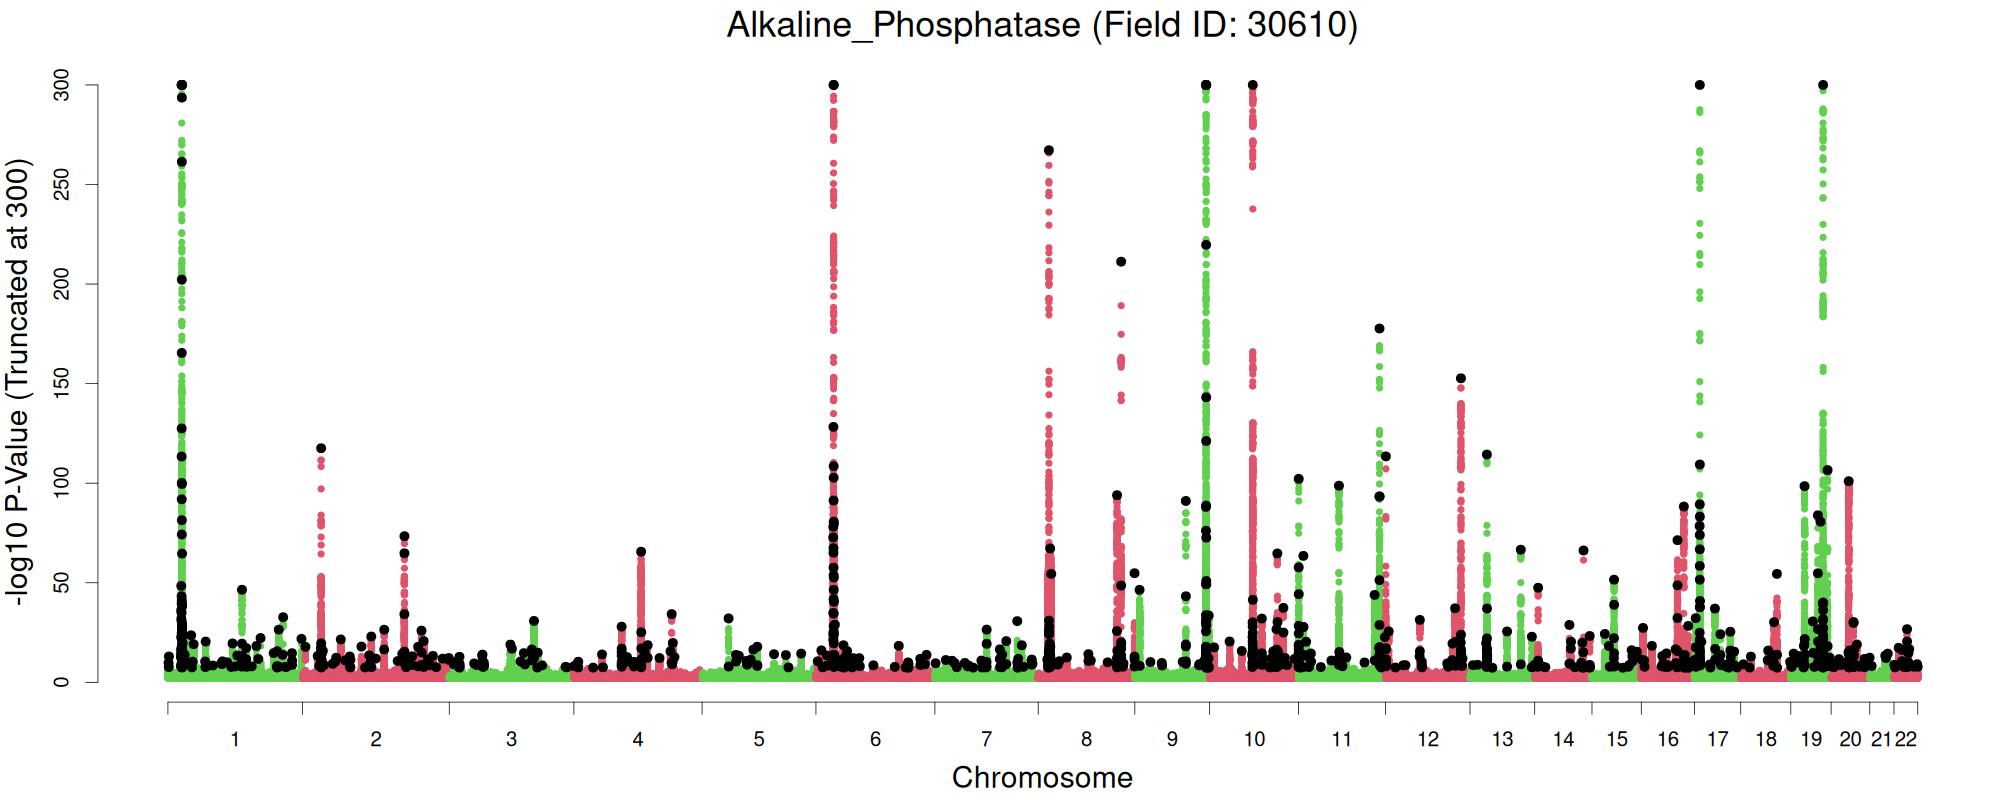
| 21 | Alkaline Phosphatase | 30610 | 437742 | 0.27 | 73278 | 1055 | 0.171 | Manhattan | Summary Stats | PGS Weights |
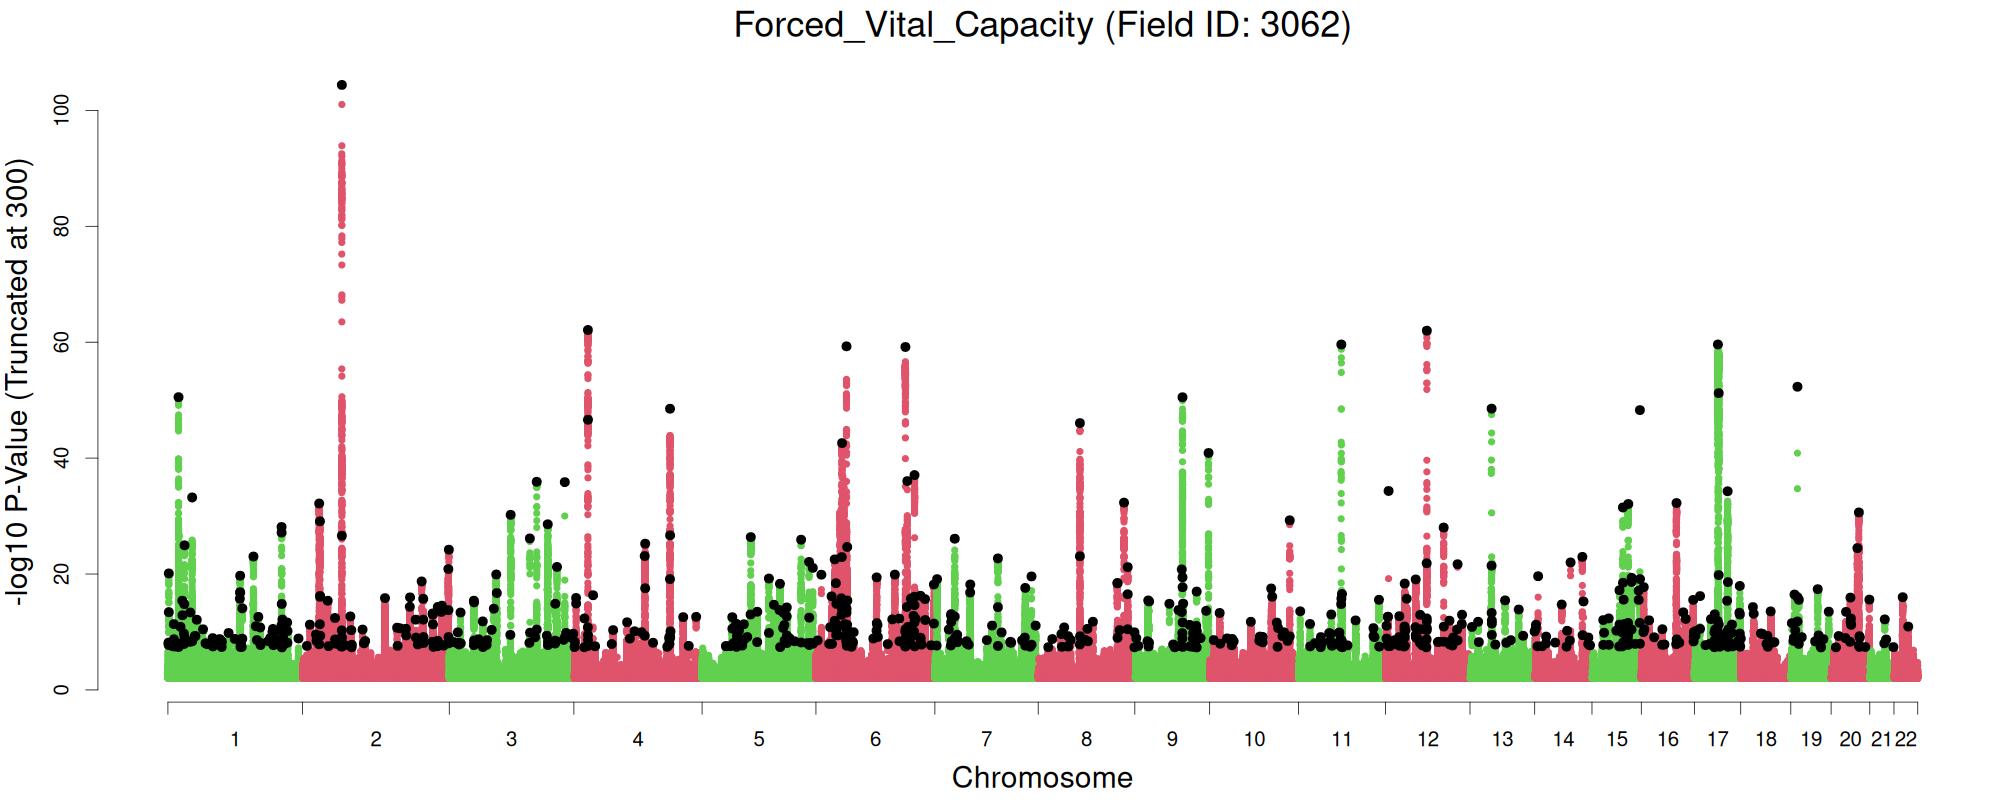
| 22 | Forced Vital Capacity | 3062 | 418461 | 0.27 | 66049 | 757 | 0.109 | Manhattan | Summary Stats | PGS Weights |
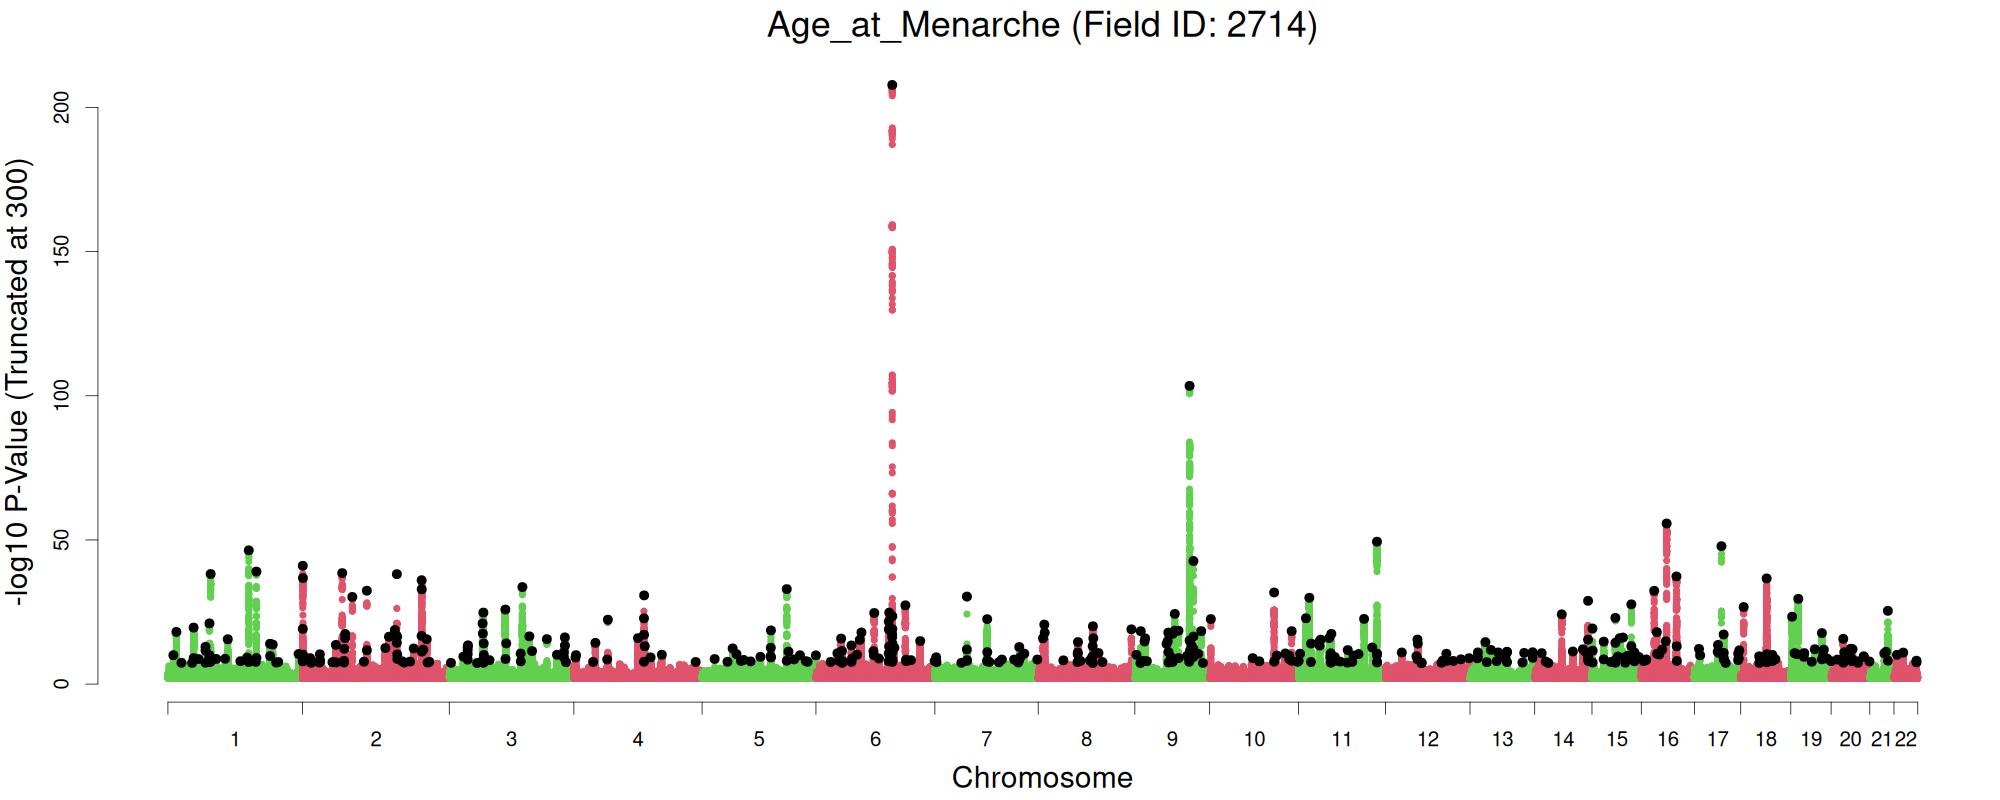
| 23 | Age at Menarche | 2714 | 242113 | 0.262 | 38997 | 443 | 0.114 | Manhattan | Summary Stats | PGS Weights |
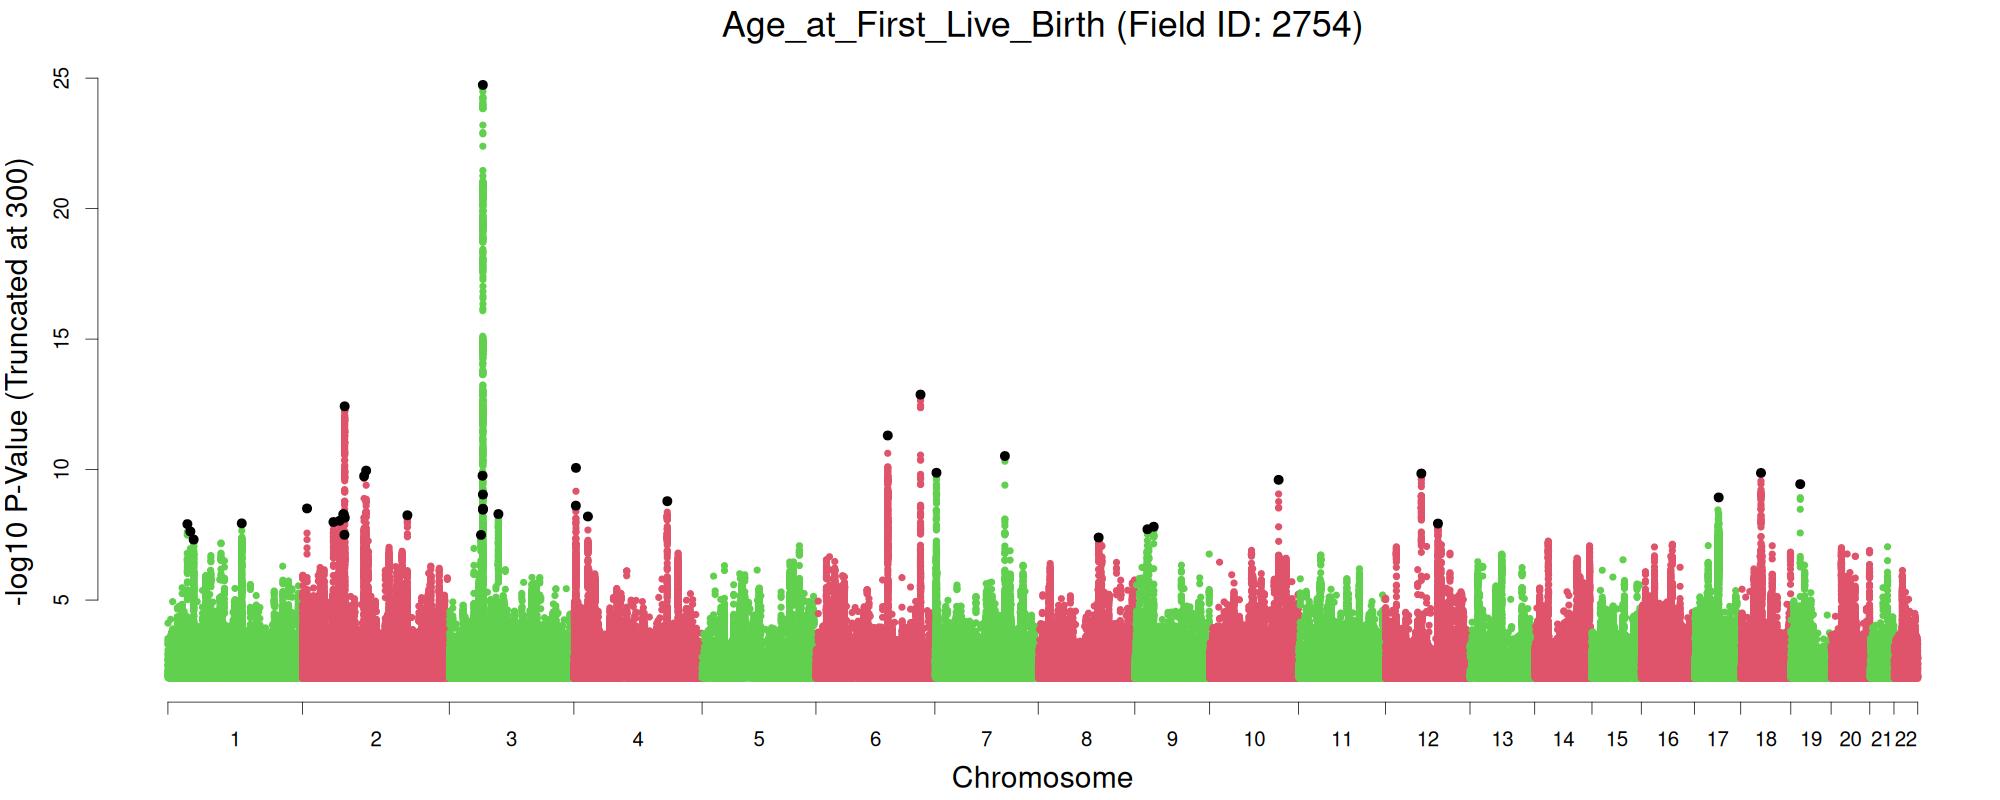
| 24 | Age at First Live Birth | 2754 | 169334 | 0.258 | 1672 | 39 | 0.051 | Manhattan | Summary Stats | PGS Weights |
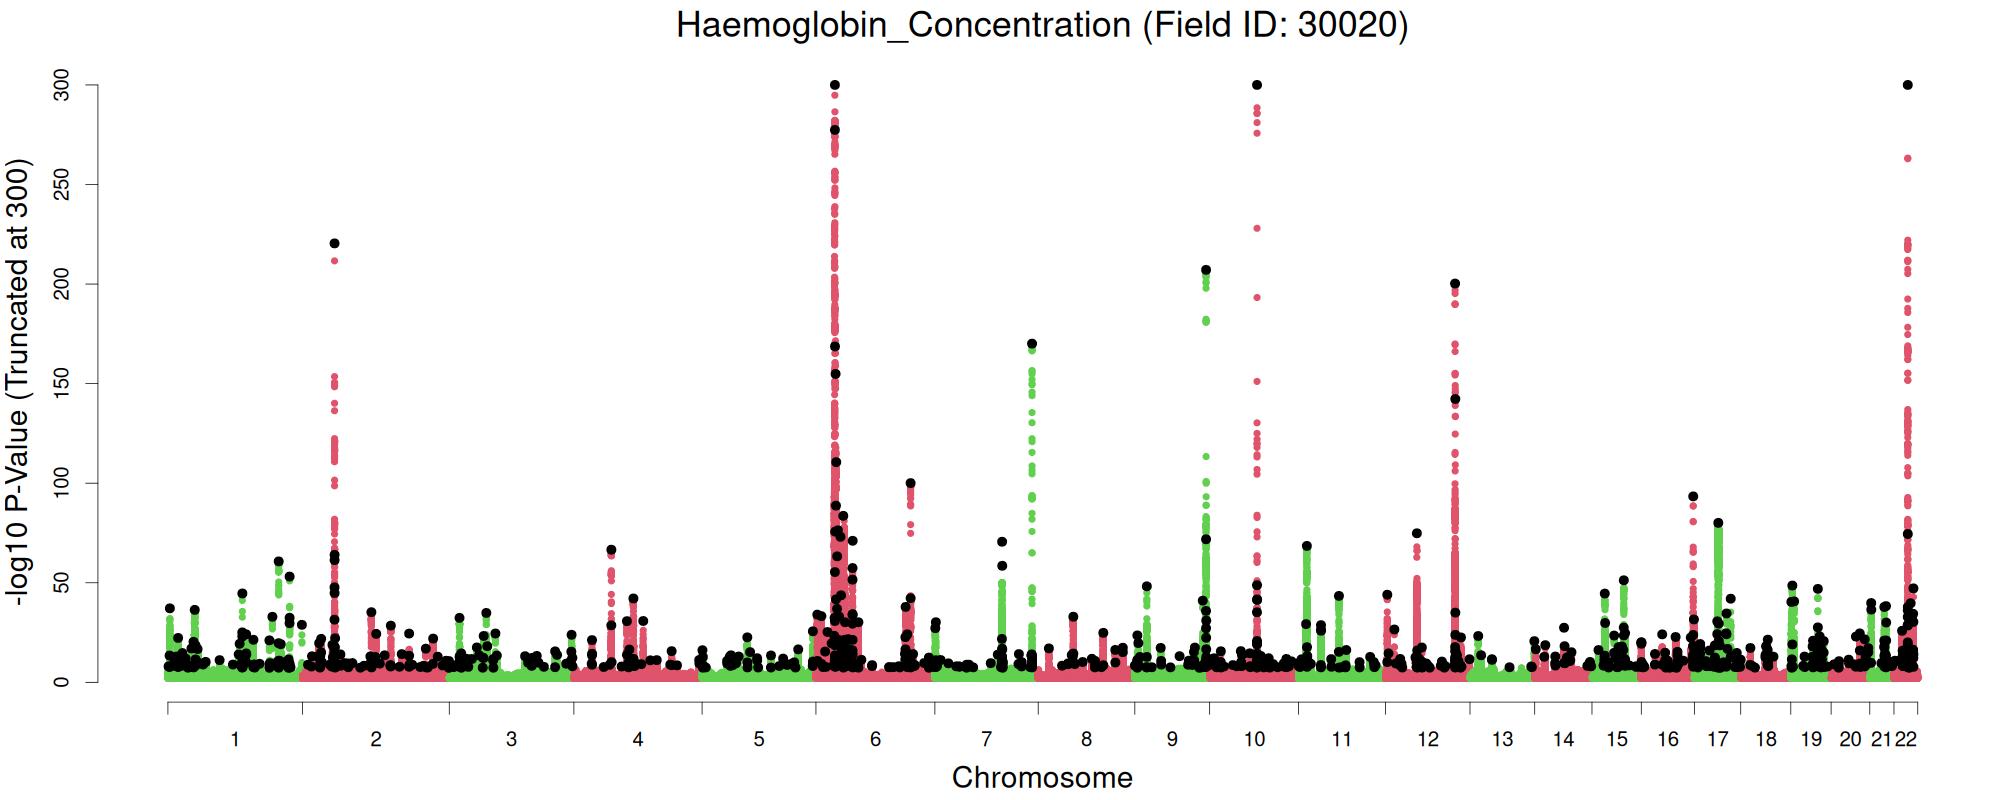
| 25 | Haemoglobin Concentration | 30020 | 445368 | 0.246 | 89488 | 1020 | 0.121 | Manhattan | Summary Stats | PGS Weights |
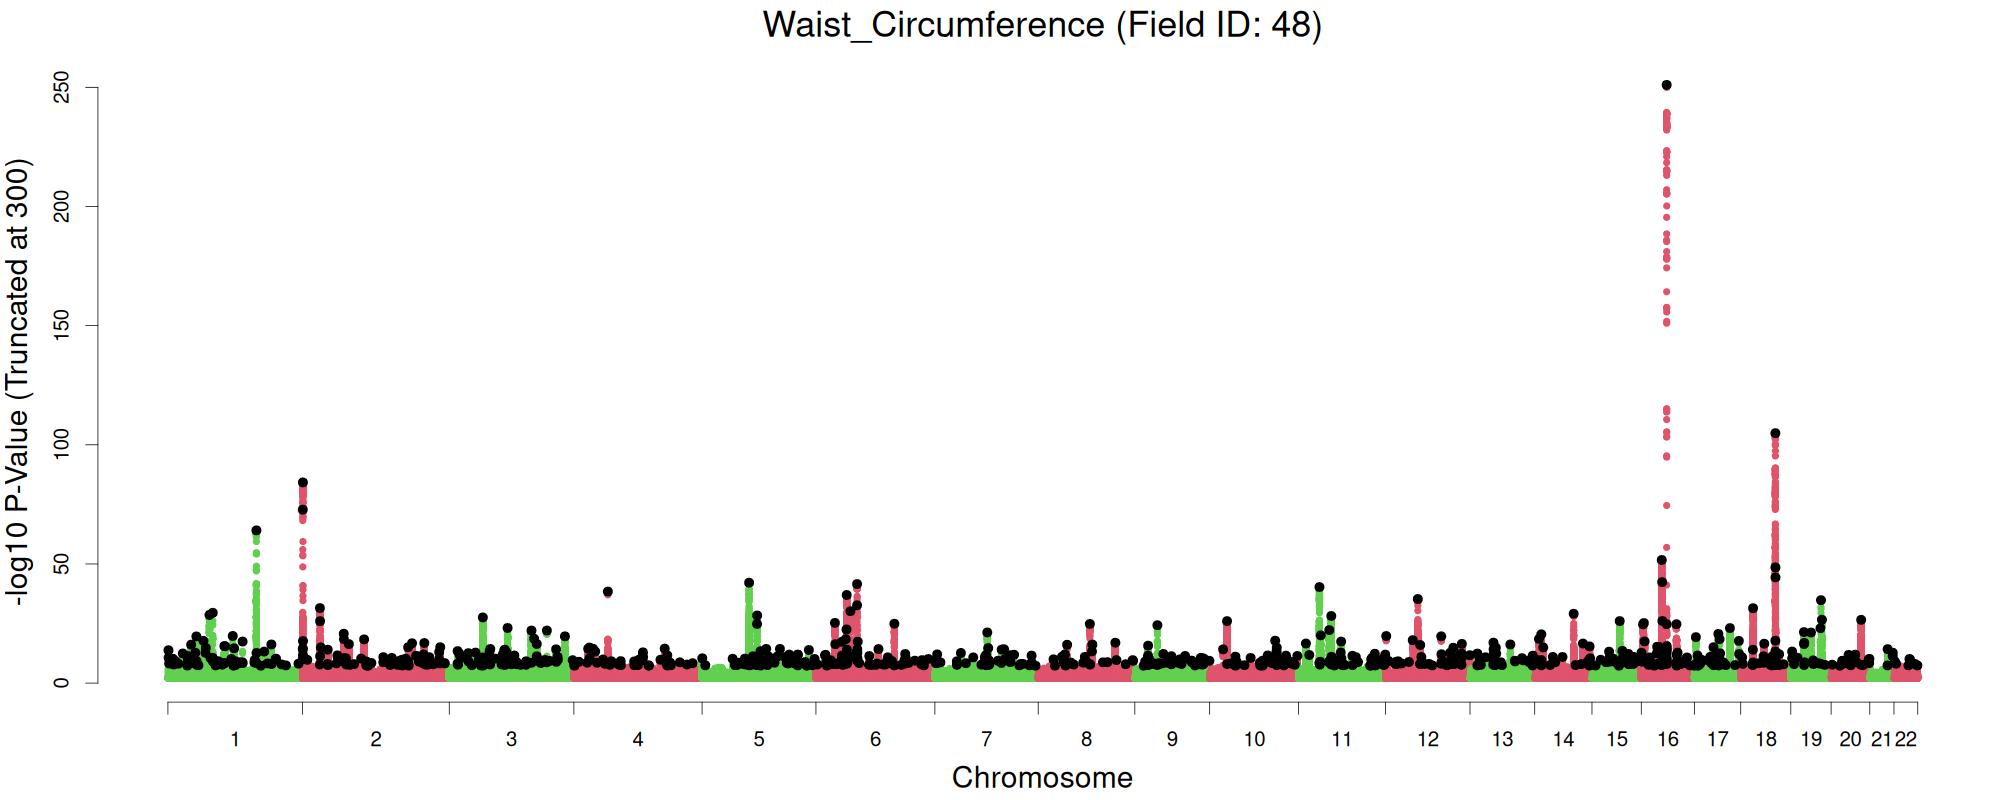
| 26 | Waist Circumference | 48 | 458290 | 0.245 | 57213 | 825 | 0.118 | Manhattan | Summary Stats | PGS Weights |
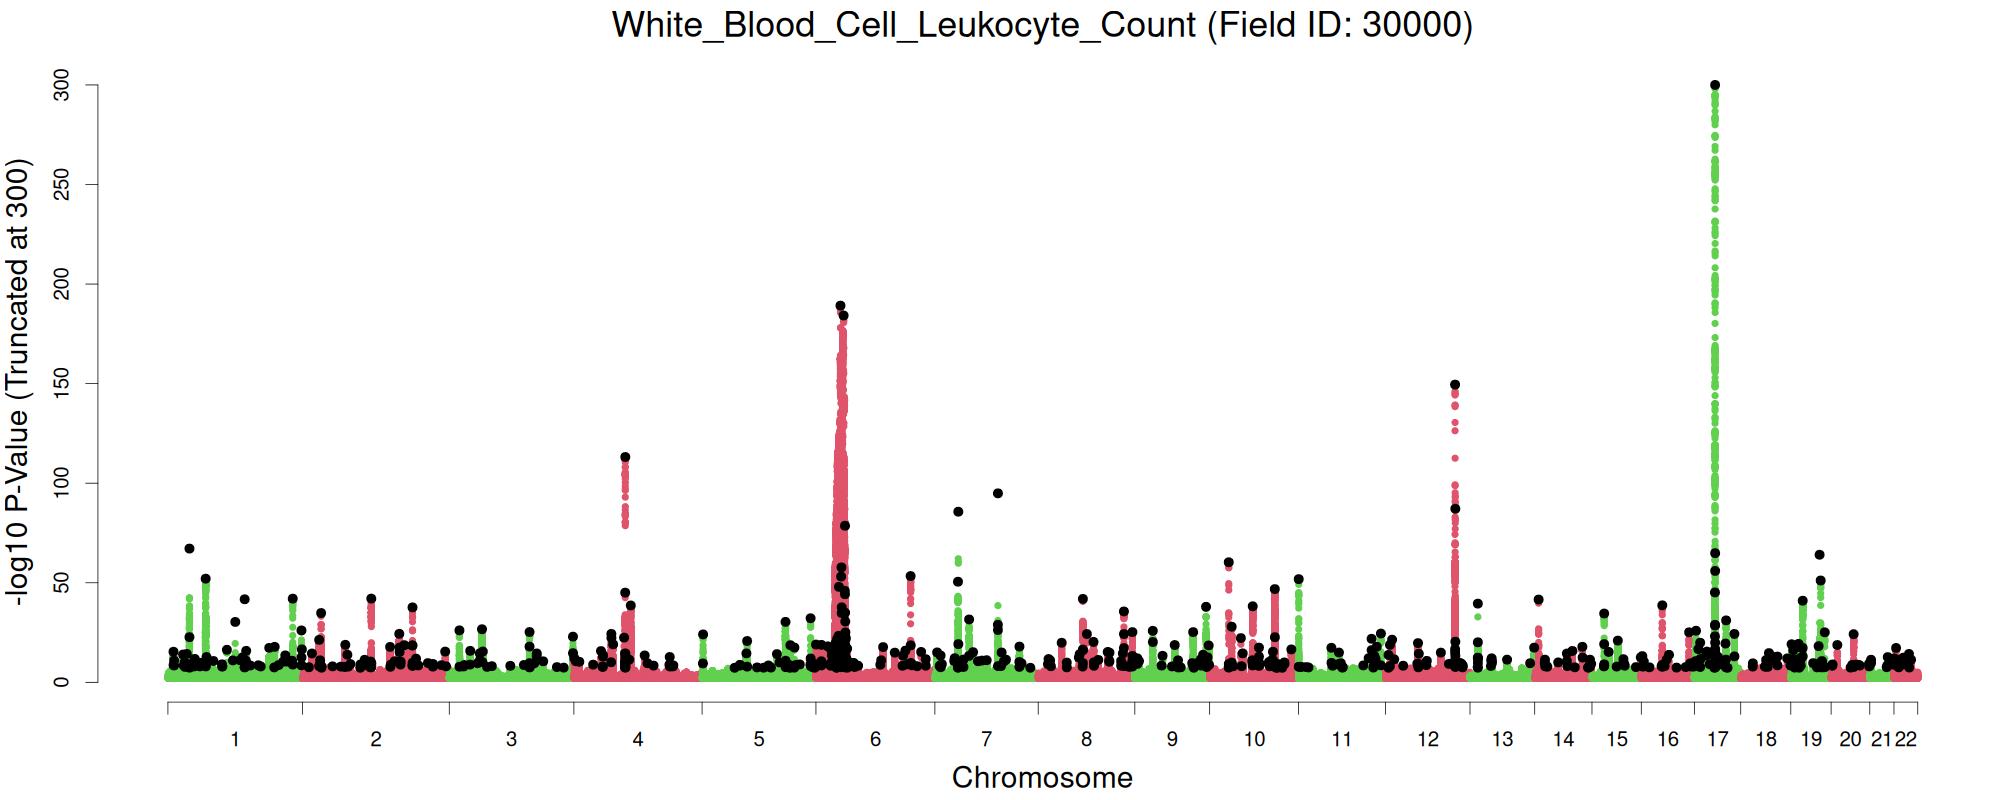
| 27 | White Blood Cell Leukocyte Count | 30000 | 445363 | 0.244 | 69821 | 688 | 0.089 | Manhattan | Summary Stats | PGS Weights |
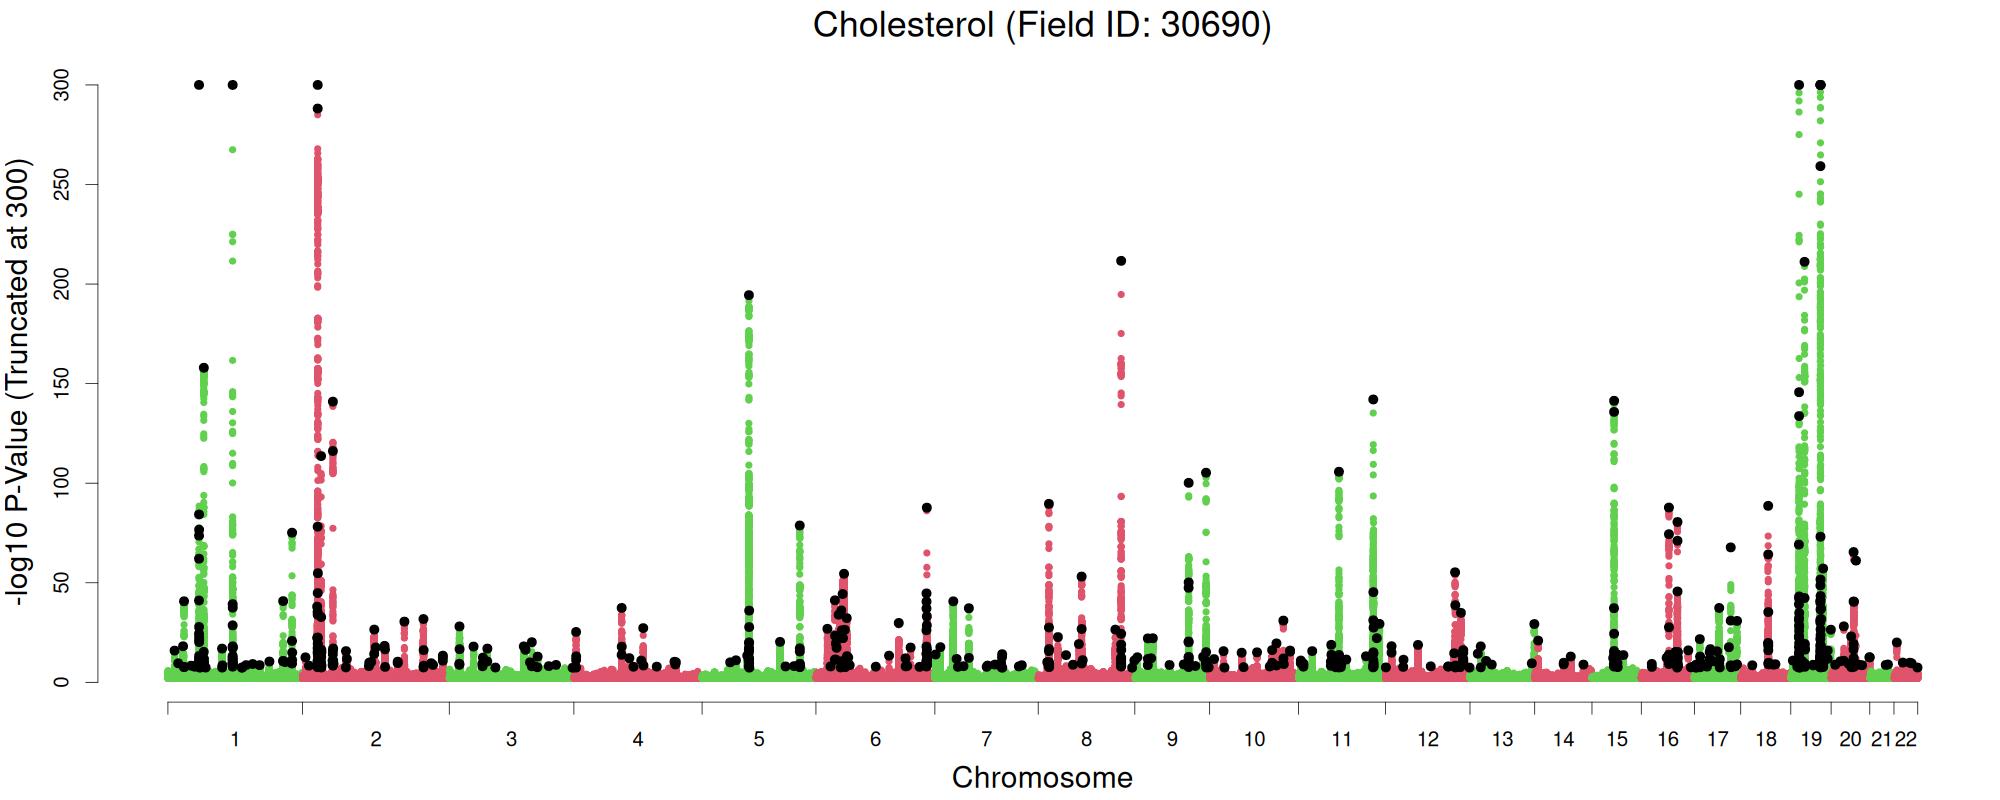
| 28 | Cholesterol | 30690 | 437724 | 0.242 | 57078 | 676 | 0.116 | Manhattan | Summary Stats | PGS Weights |
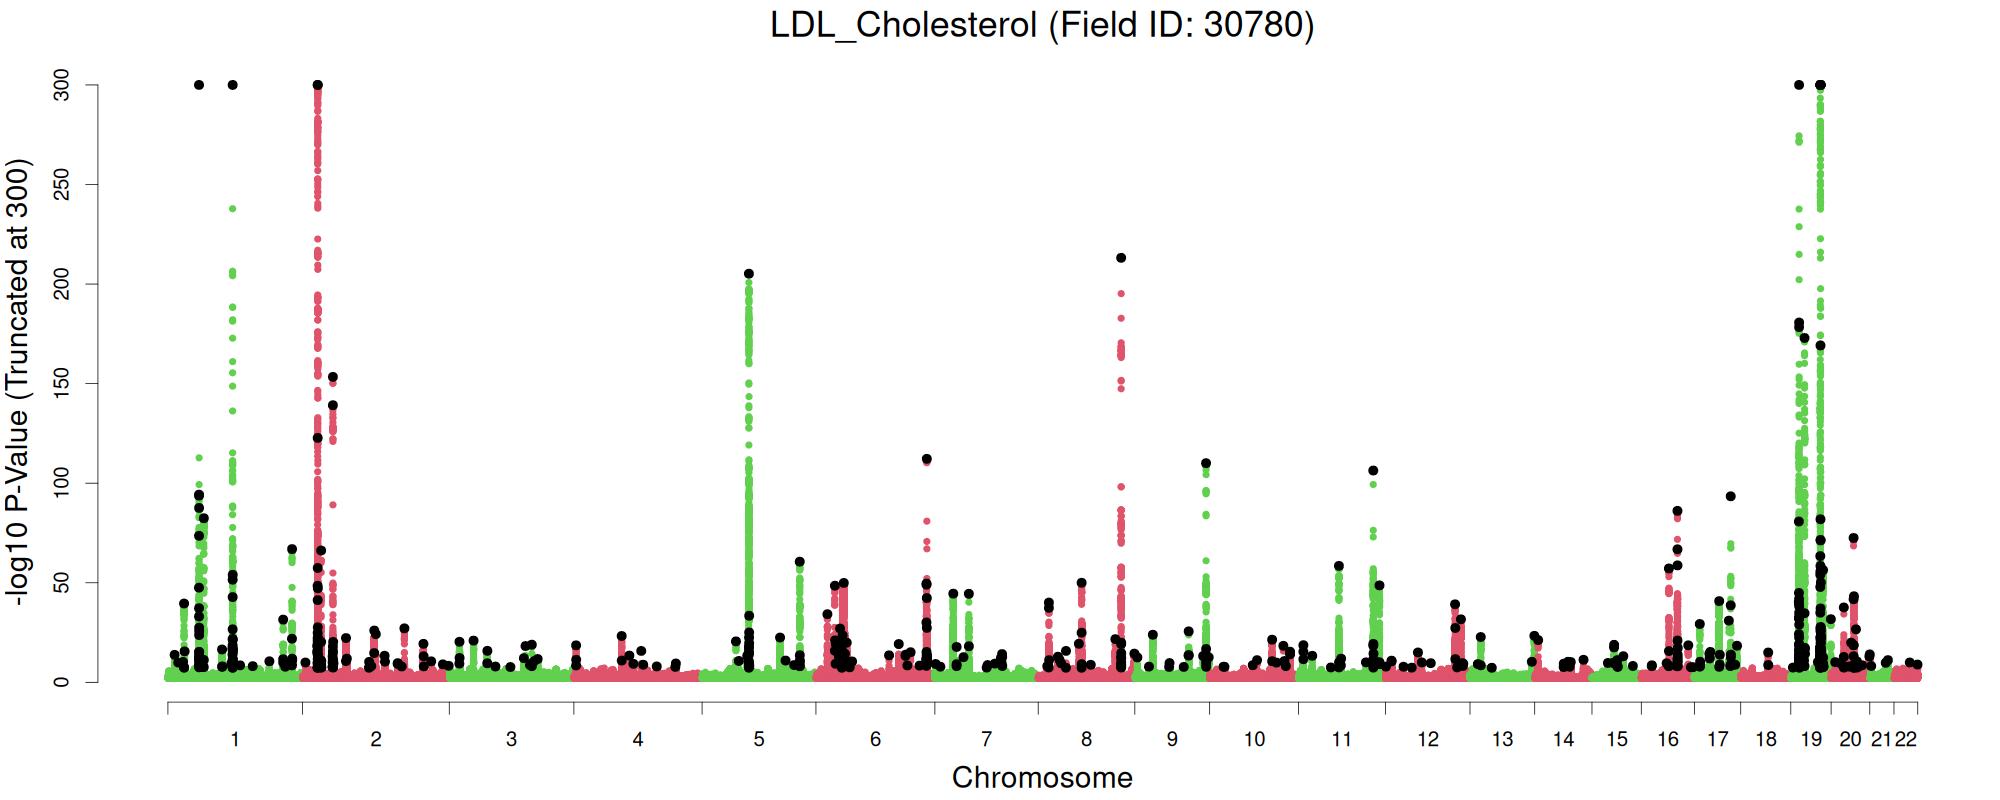
| 29 | LDL Cholesterol | 30780 | 436914 | 0.236 | 46045 | 608 | 0.117 | Manhattan | Summary Stats | PGS Weights |
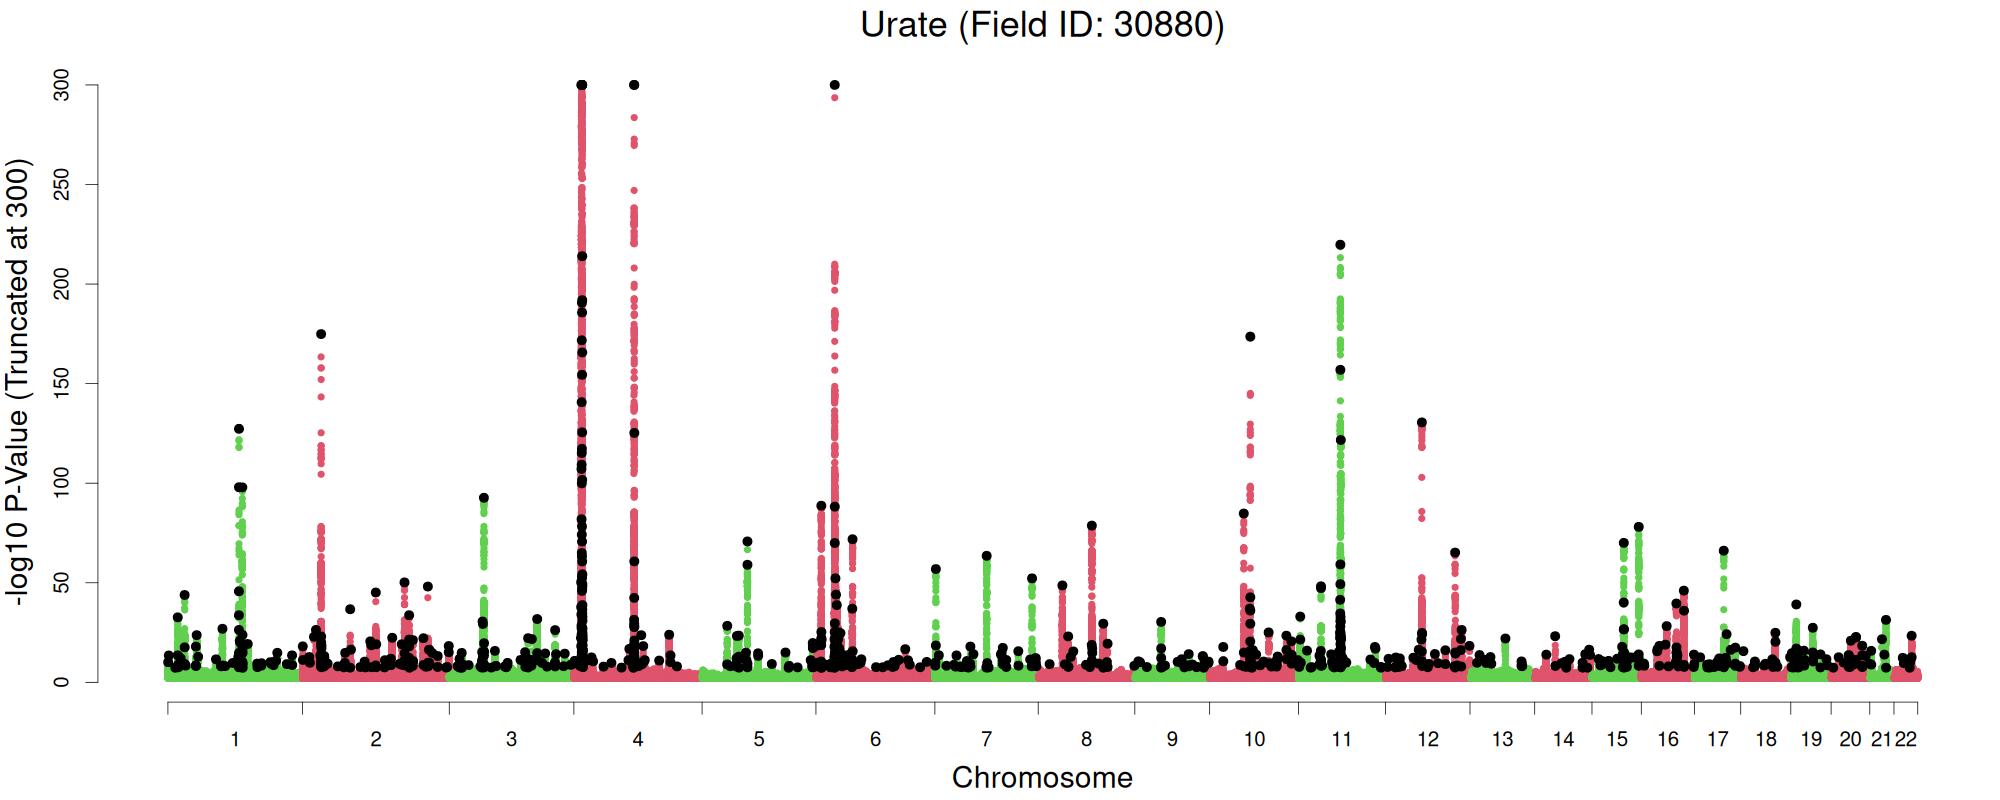
| 30 | Urate | 30880 | 437200 | 0.223 | 74640 | 924 | 0.161 | Manhattan | Summary Stats | PGS Weights |
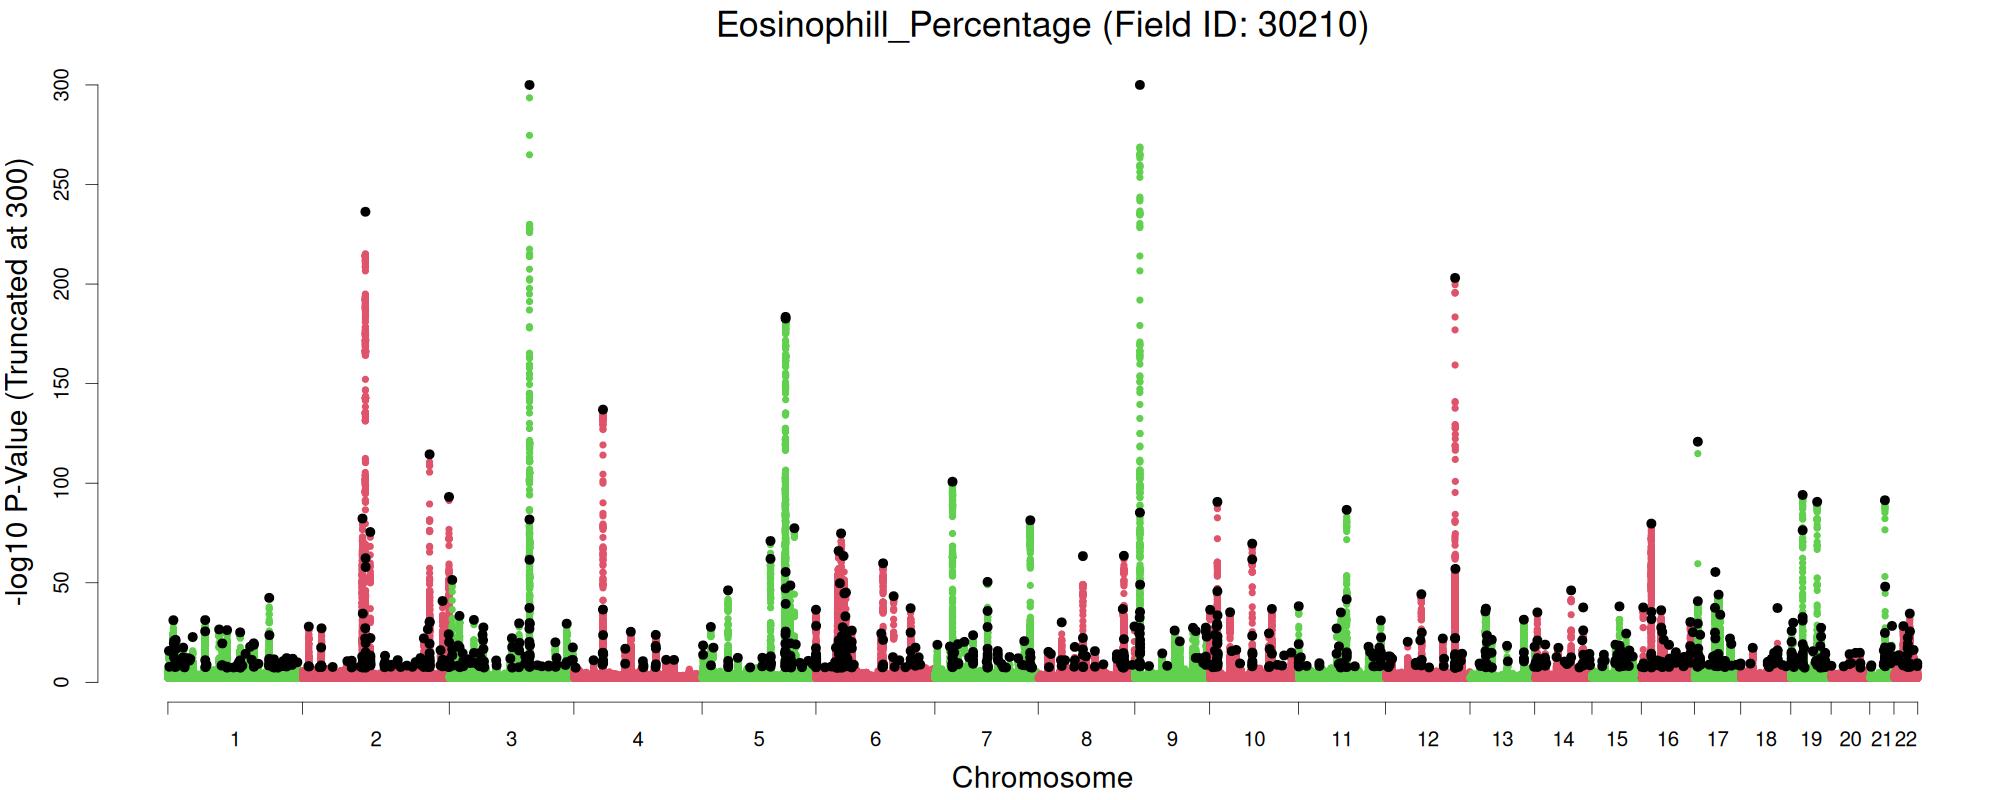
| 31 | Eosinophill Percentage | 30210 | 444577 | 0.223 | 89408 | 1018 | 0.11 | Manhattan | Summary Stats | PGS Weights |
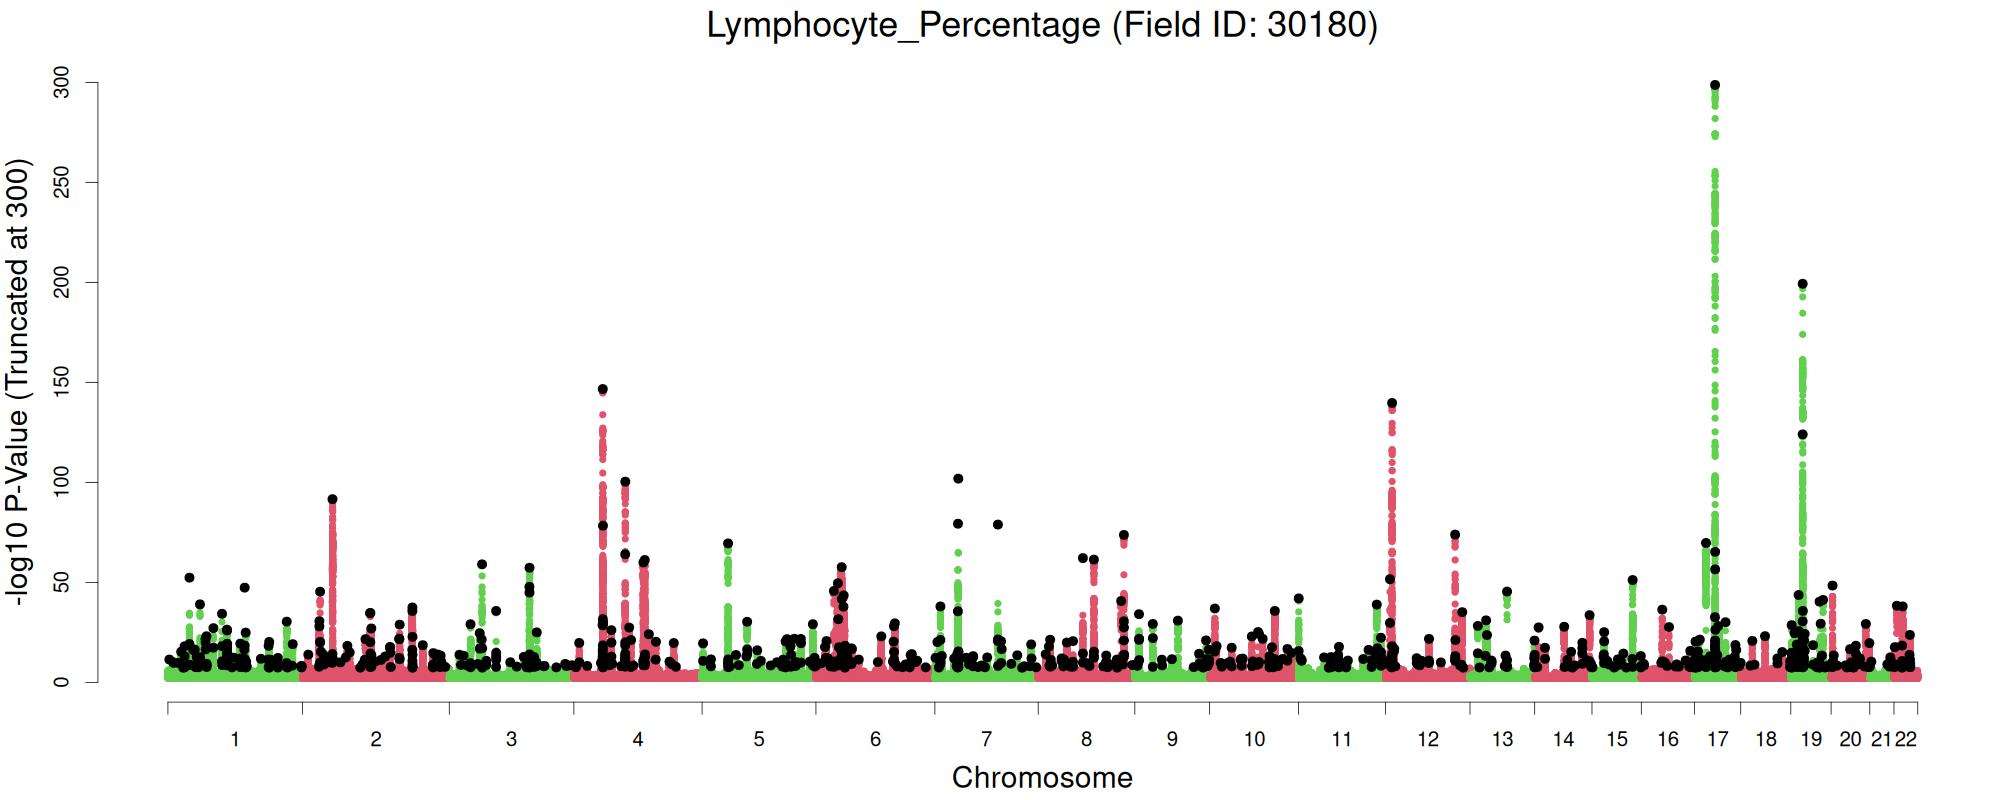
| 32 | Lymphocyte Percentage | 30180 | 444577 | 0.218 | 74302 | 952 | 0.112 | Manhattan | Summary Stats | PGS Weights |
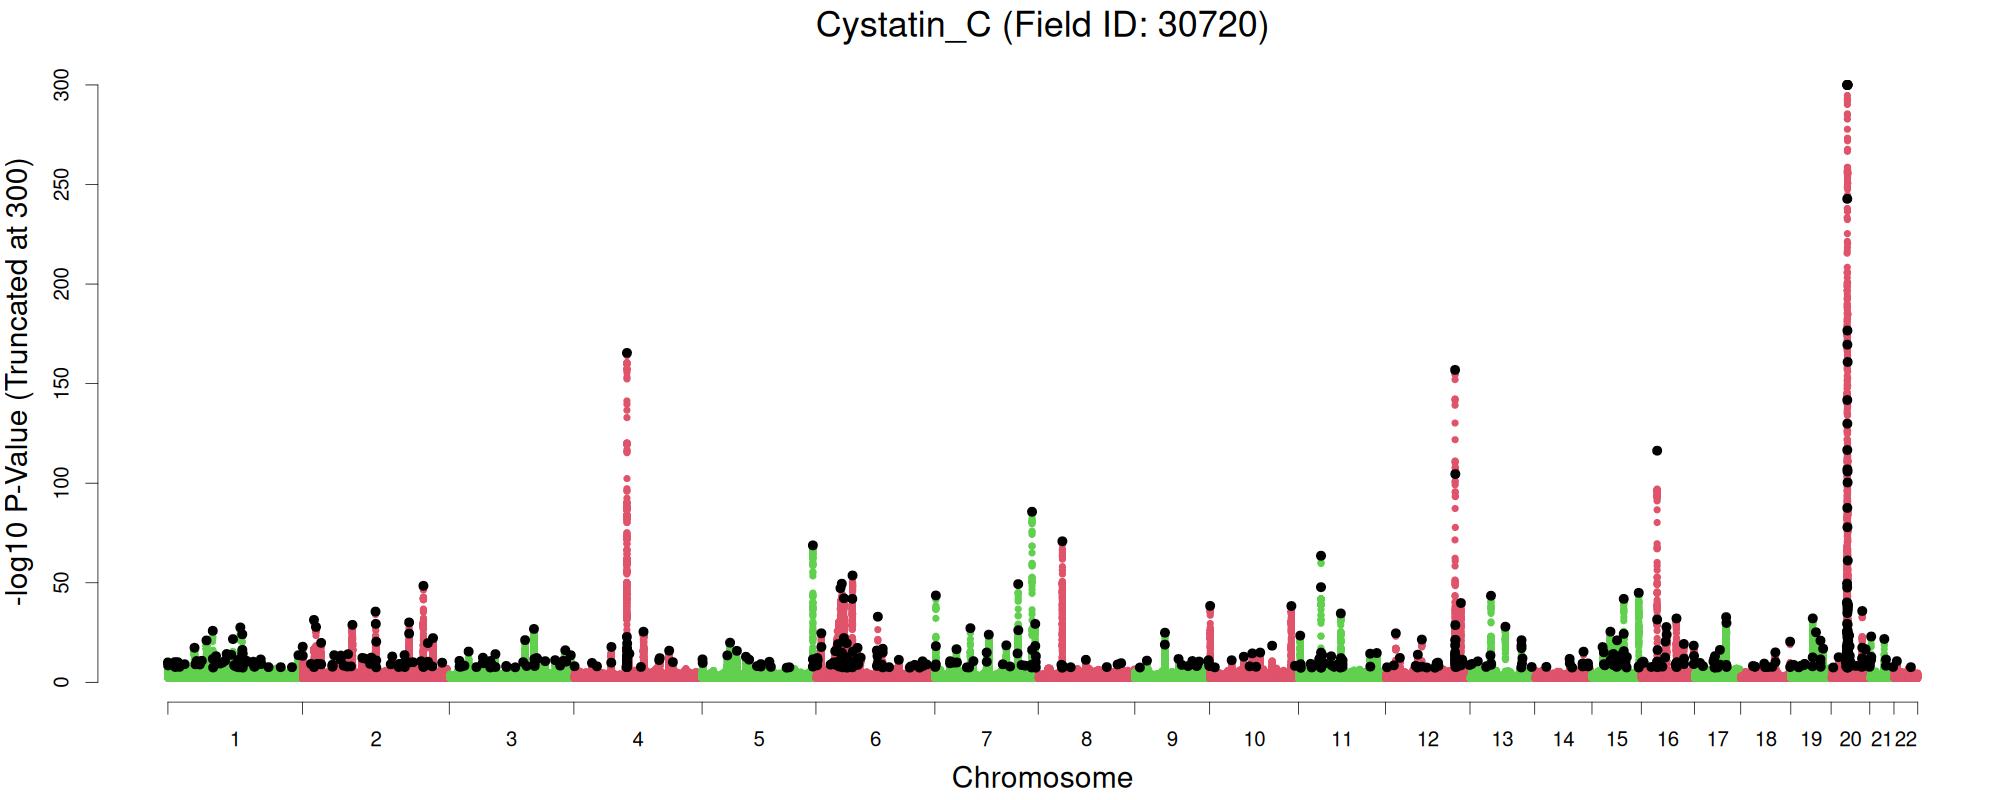
| 33 | Cystatin C | 30720 | 437692 | 0.2 | 55741 | 658 | 0.113 | Manhattan | Summary Stats | PGS Weights |
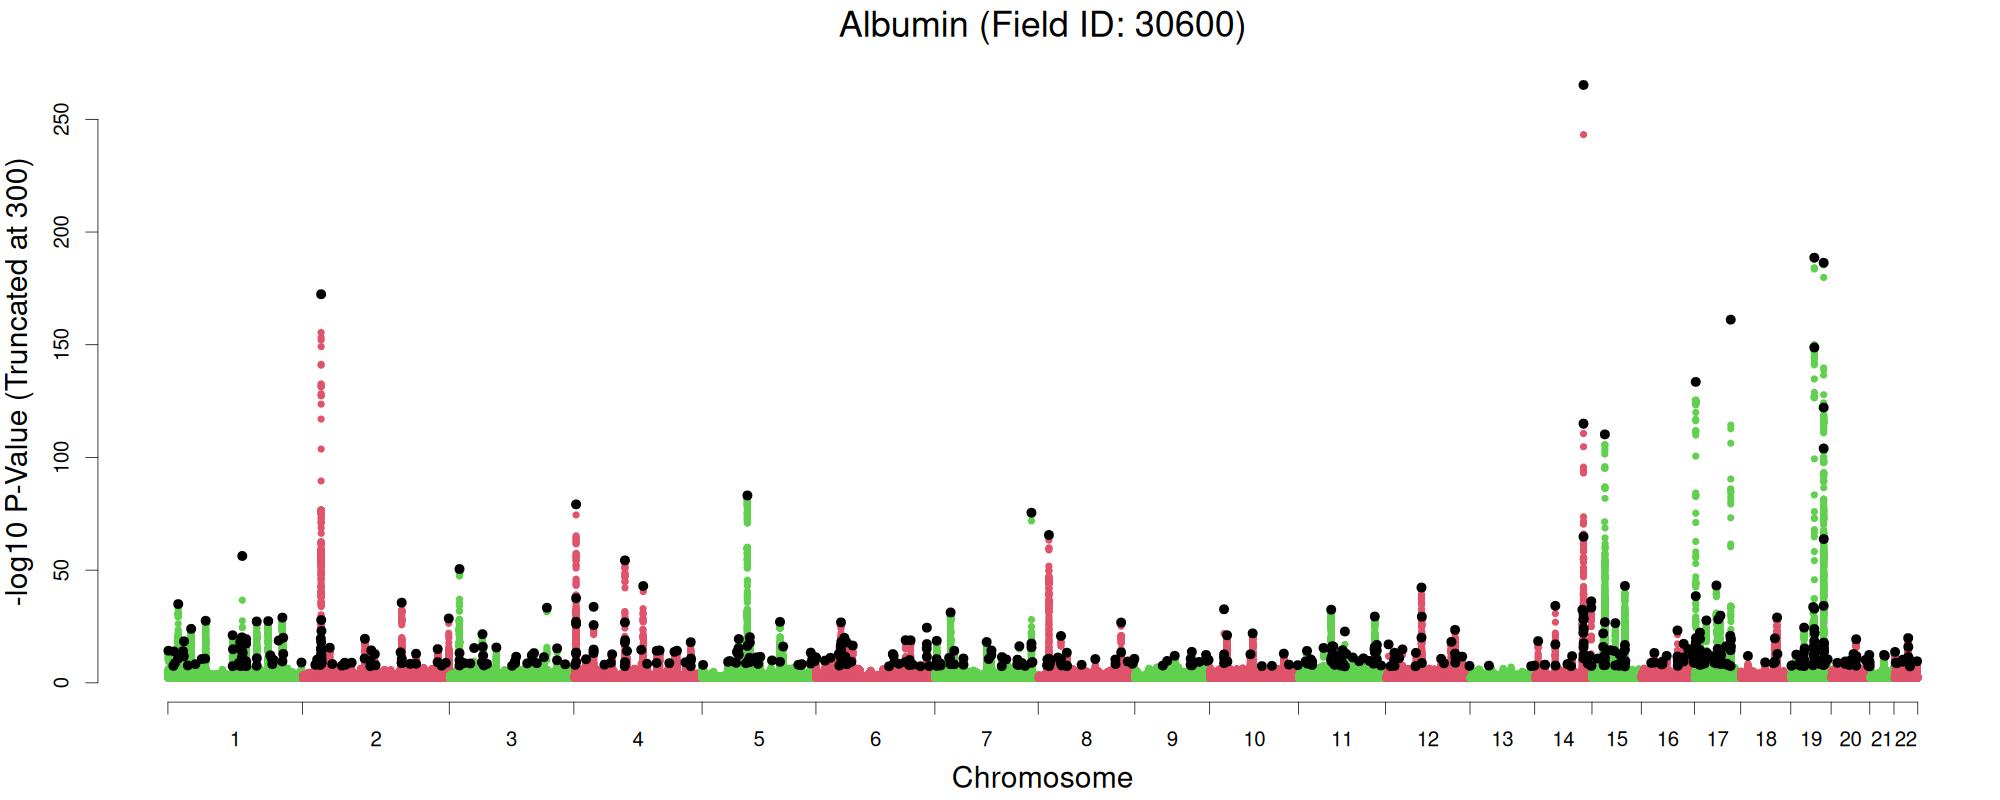
| 34 | Albumin | 30600 | 400799 | 0.199 | 45454 | 612 | 0.092 | Manhattan | Summary Stats | PGS Weights |
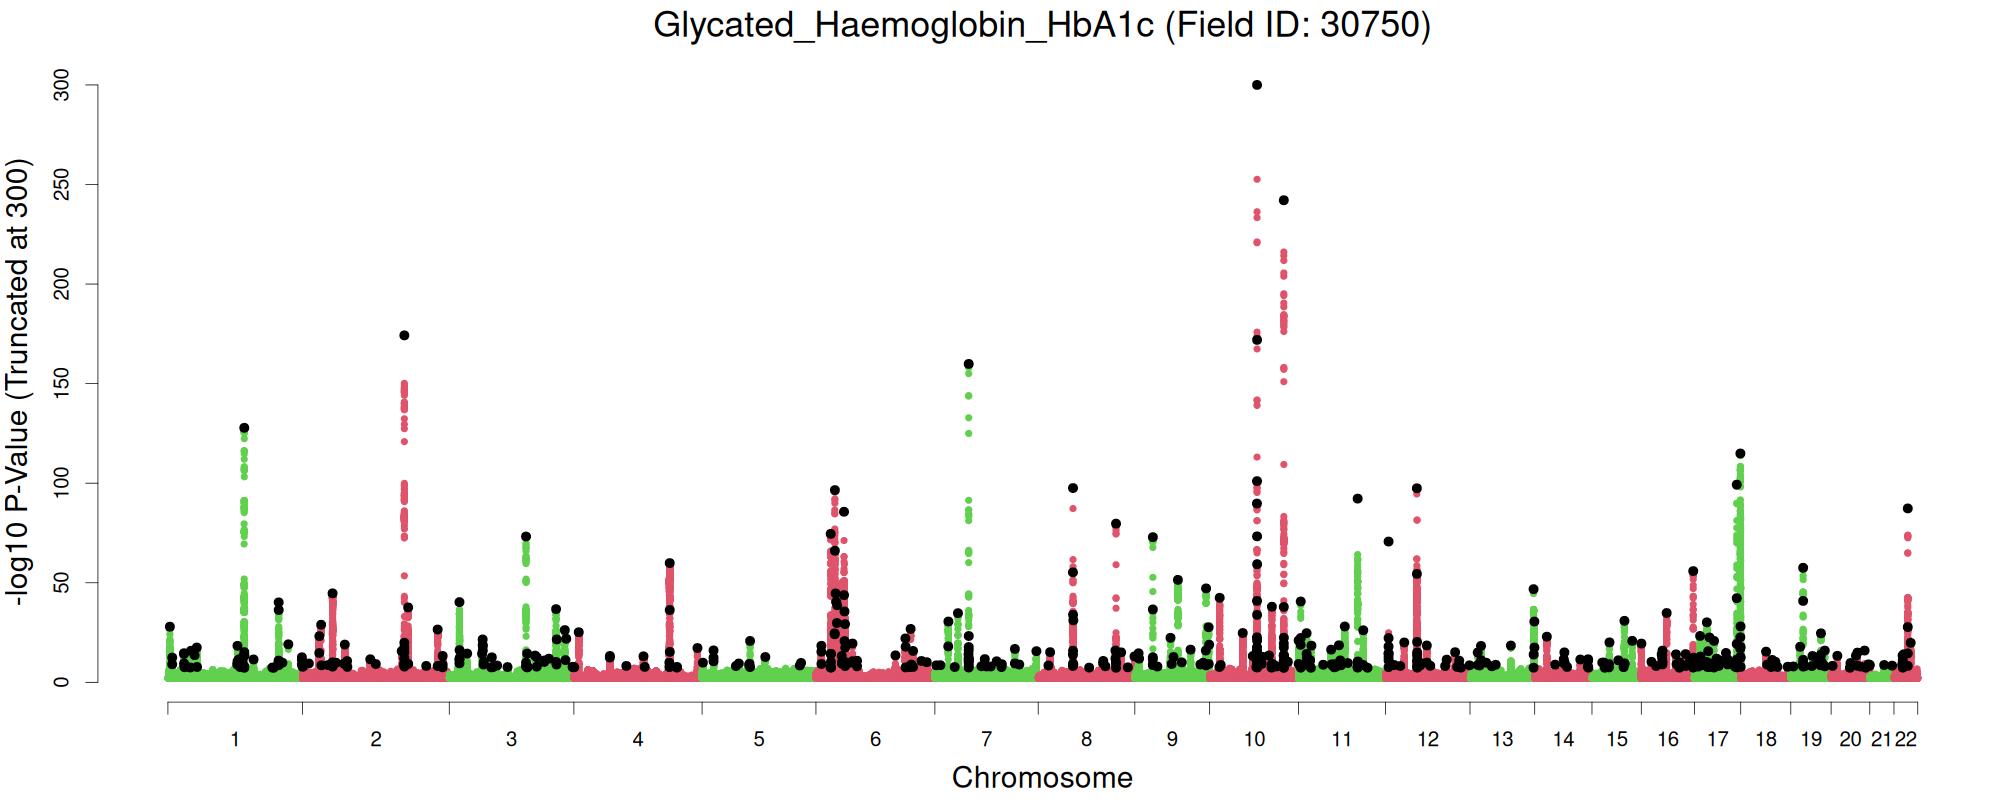
| 35 | Glycated Haemoglobin HbA1c | 30750 | 437595 | 0.187 | 54392 | 576 | 0.093 | Manhattan | Summary Stats | PGS Weights |
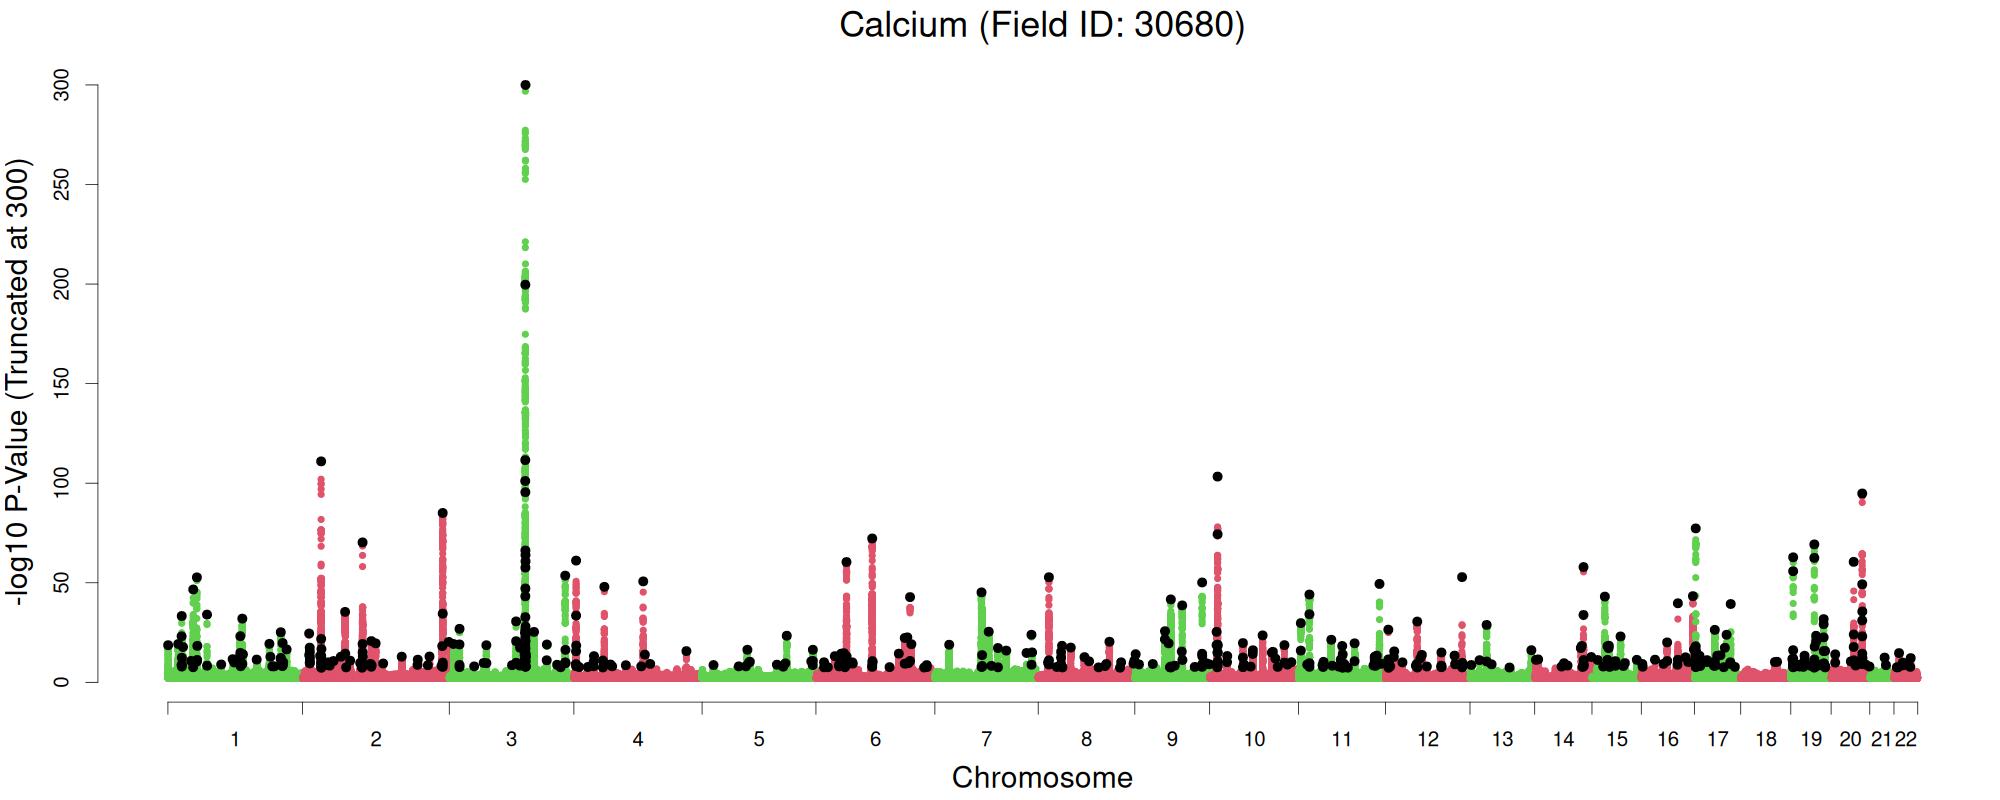
| 36 | Calcium | 30680 | 400653 | 0.178 | 36292 | 543 | 0.087 | Manhattan | Summary Stats | PGS Weights |
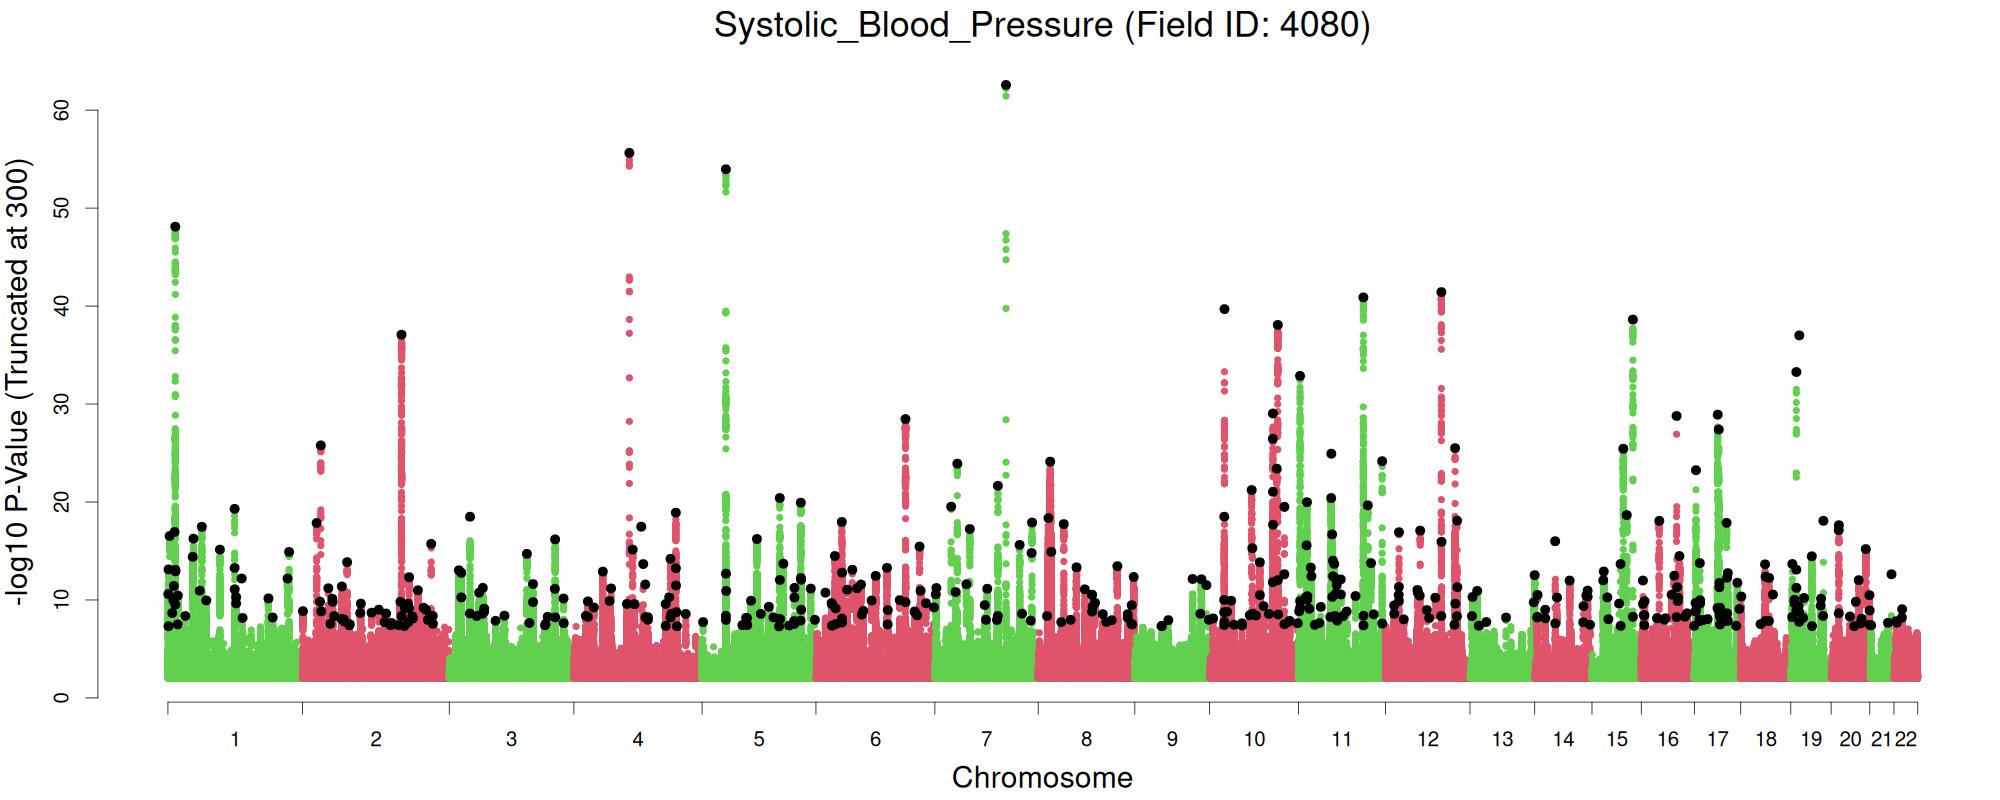
| 37 | Systolic Blood Pressure | 4080 | 428864 | 0.175 | 36934 | 475 | 0.075 | Manhattan | Summary Stats | PGS Weights |
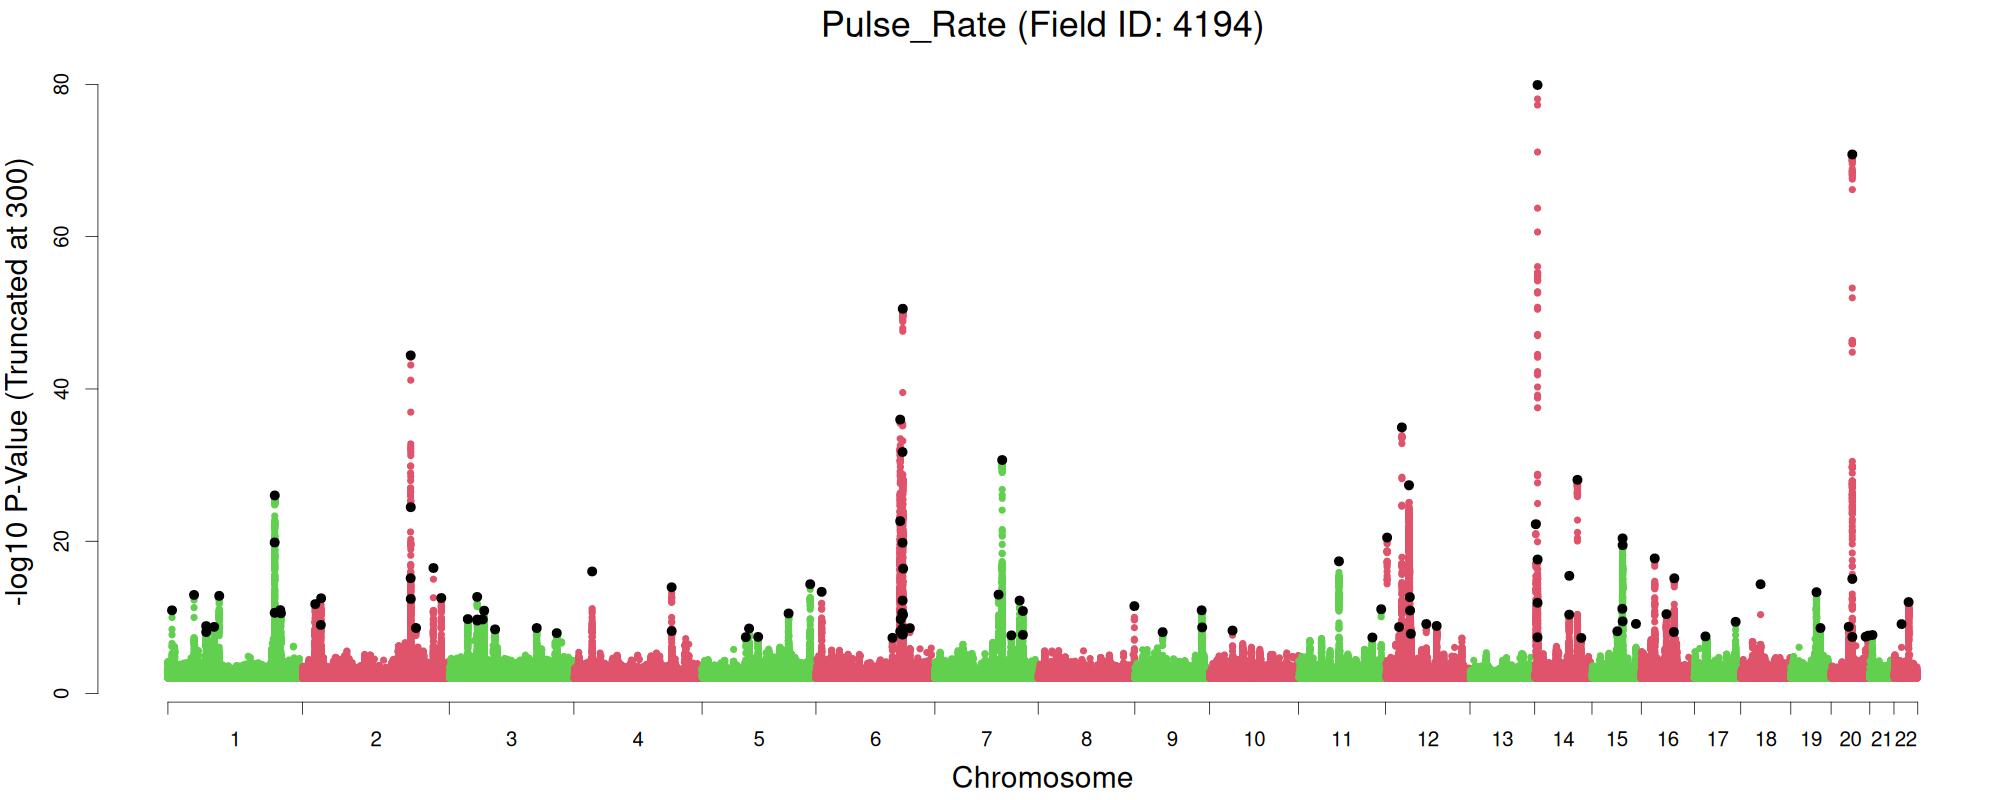
| 38 | Pulse Rate | 4194 | 149922 | 0.172 | 10047 | 109 | 0.05 | Manhattan | Summary Stats | PGS Weights |
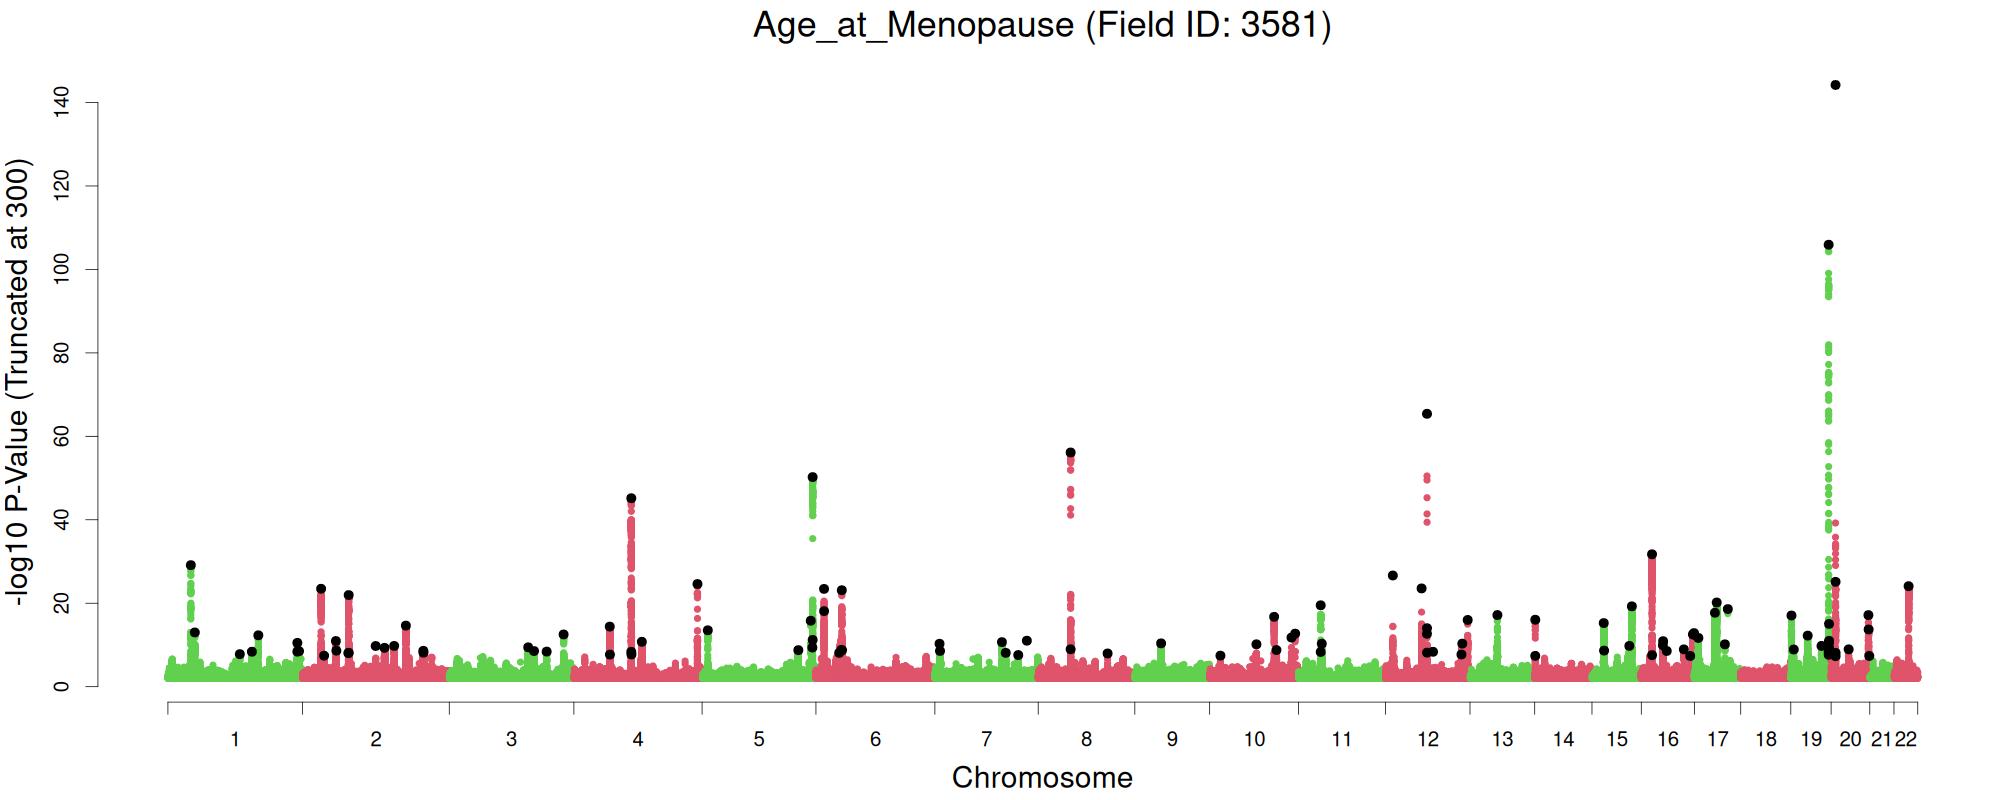
| 39 | Age at Menopause | 3581 | 142943 | 0.171 | 9675 | 115 | 0.047 | Manhattan | Summary Stats | PGS Weights |
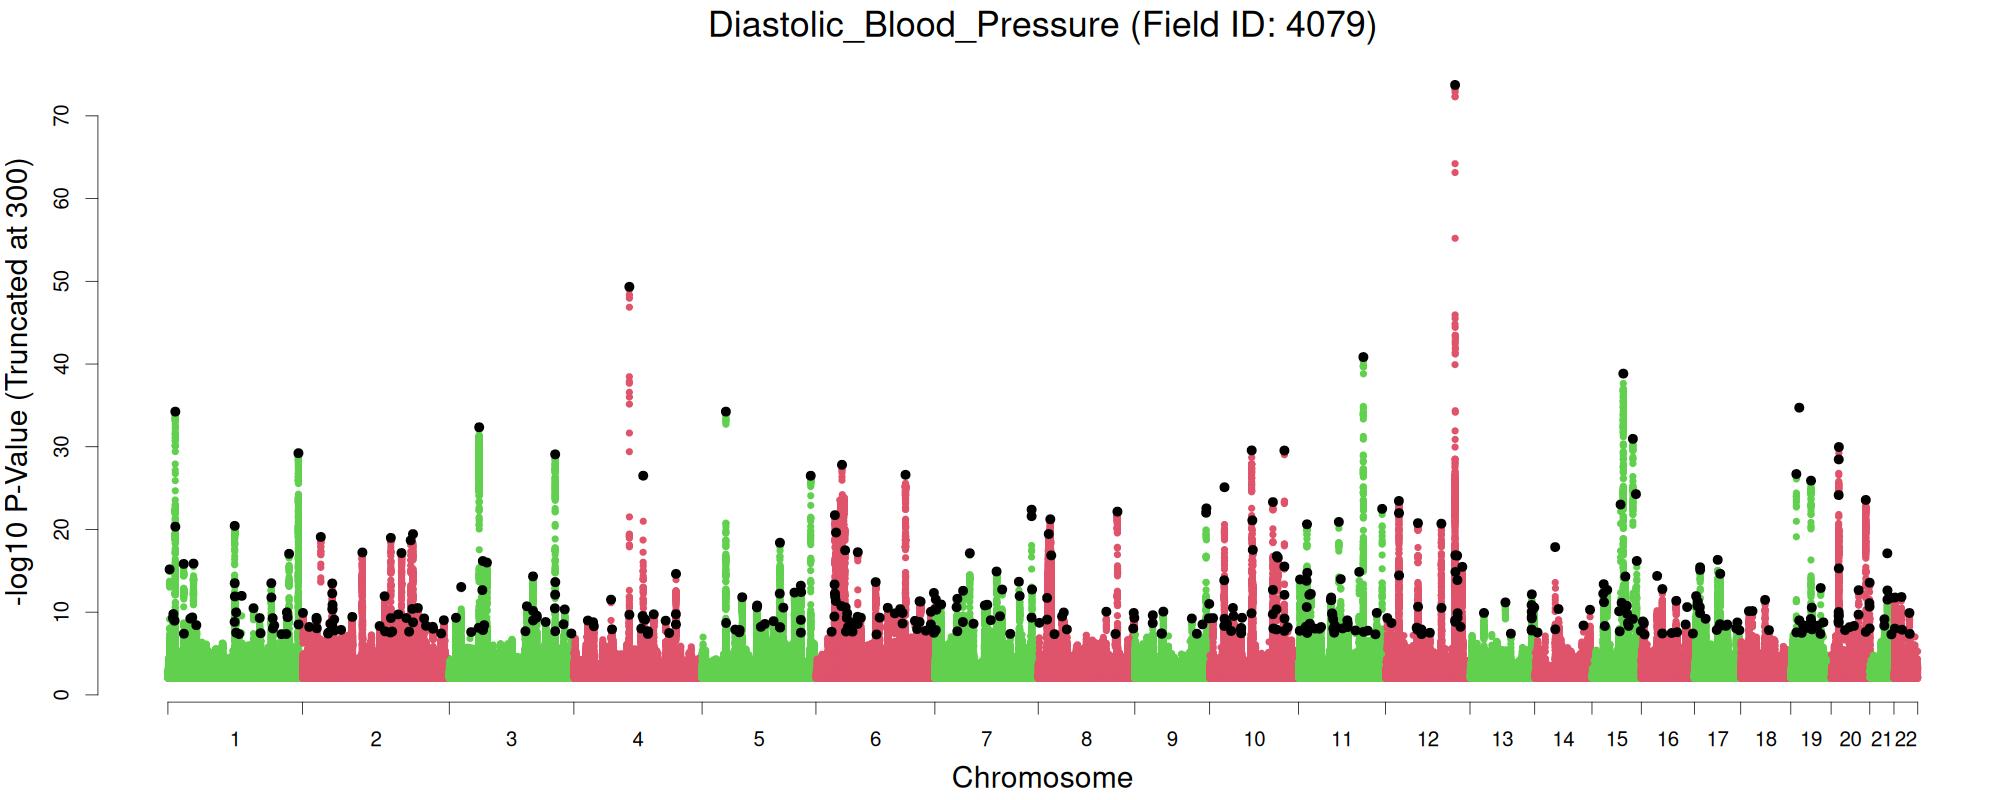
| 40 | Diastolic Blood Pressure | 4079 | 428876 | 0.171 | 40336 | 448 | 0.069 | Manhattan | Summary Stats | PGS Weights |
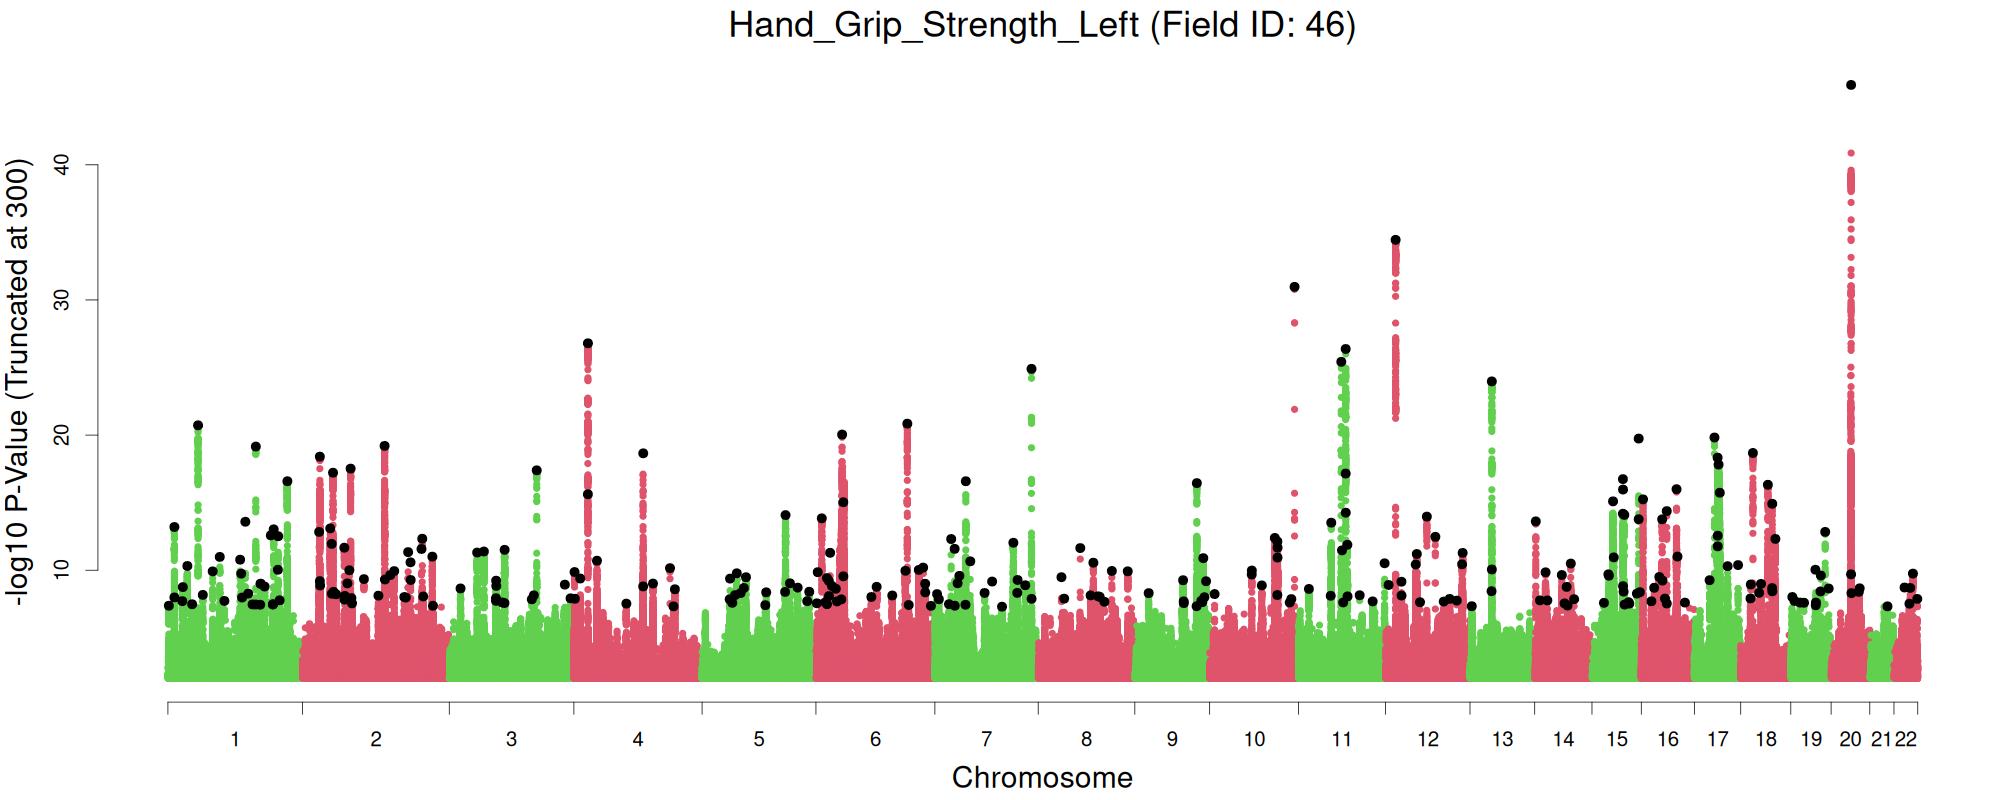
| 41 | Hand Grip Strength Left | 46 | 457162 | 0.165 | 25130 | 295 | 0.052 | Manhattan | Summary Stats | PGS Weights |
| 42 | Hand Grip Strength Right | 47 | 457224 | 0.164 | 26502 | 340 | 0.059 | Manhattan | Summary Stats | PGS Weights |
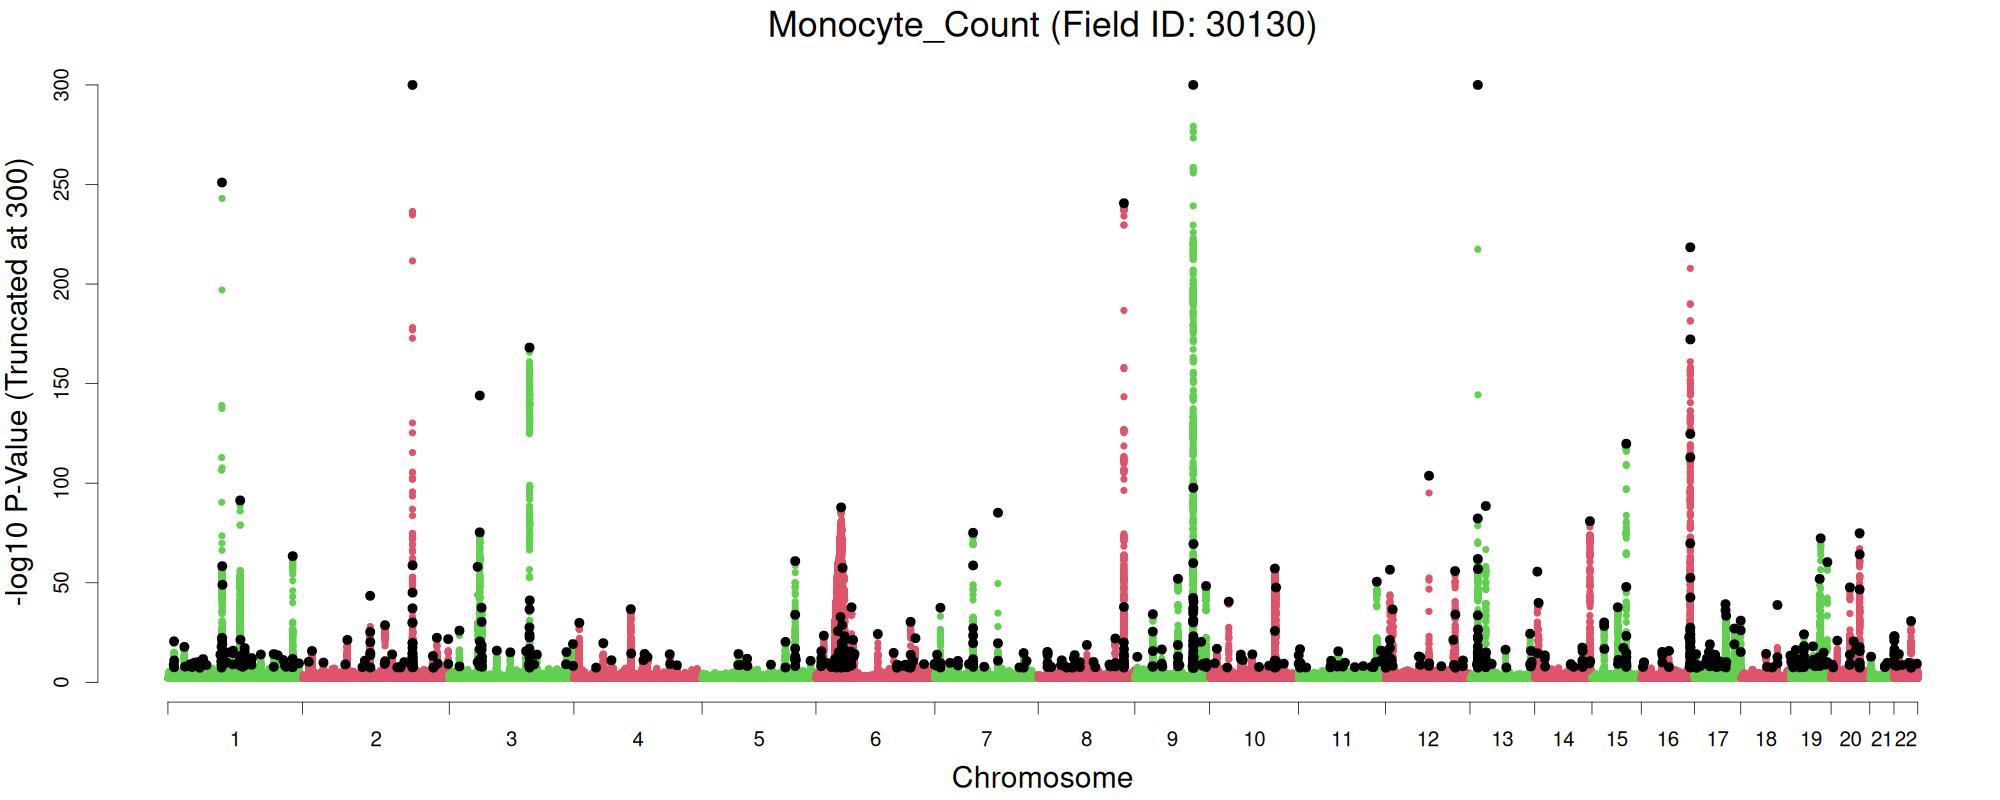
| 43 | Monocyte Count | 30130 | 444571 | 0.163 | 51262 | 689 | 0.101 | Manhattan | Summary Stats | PGS Weights |
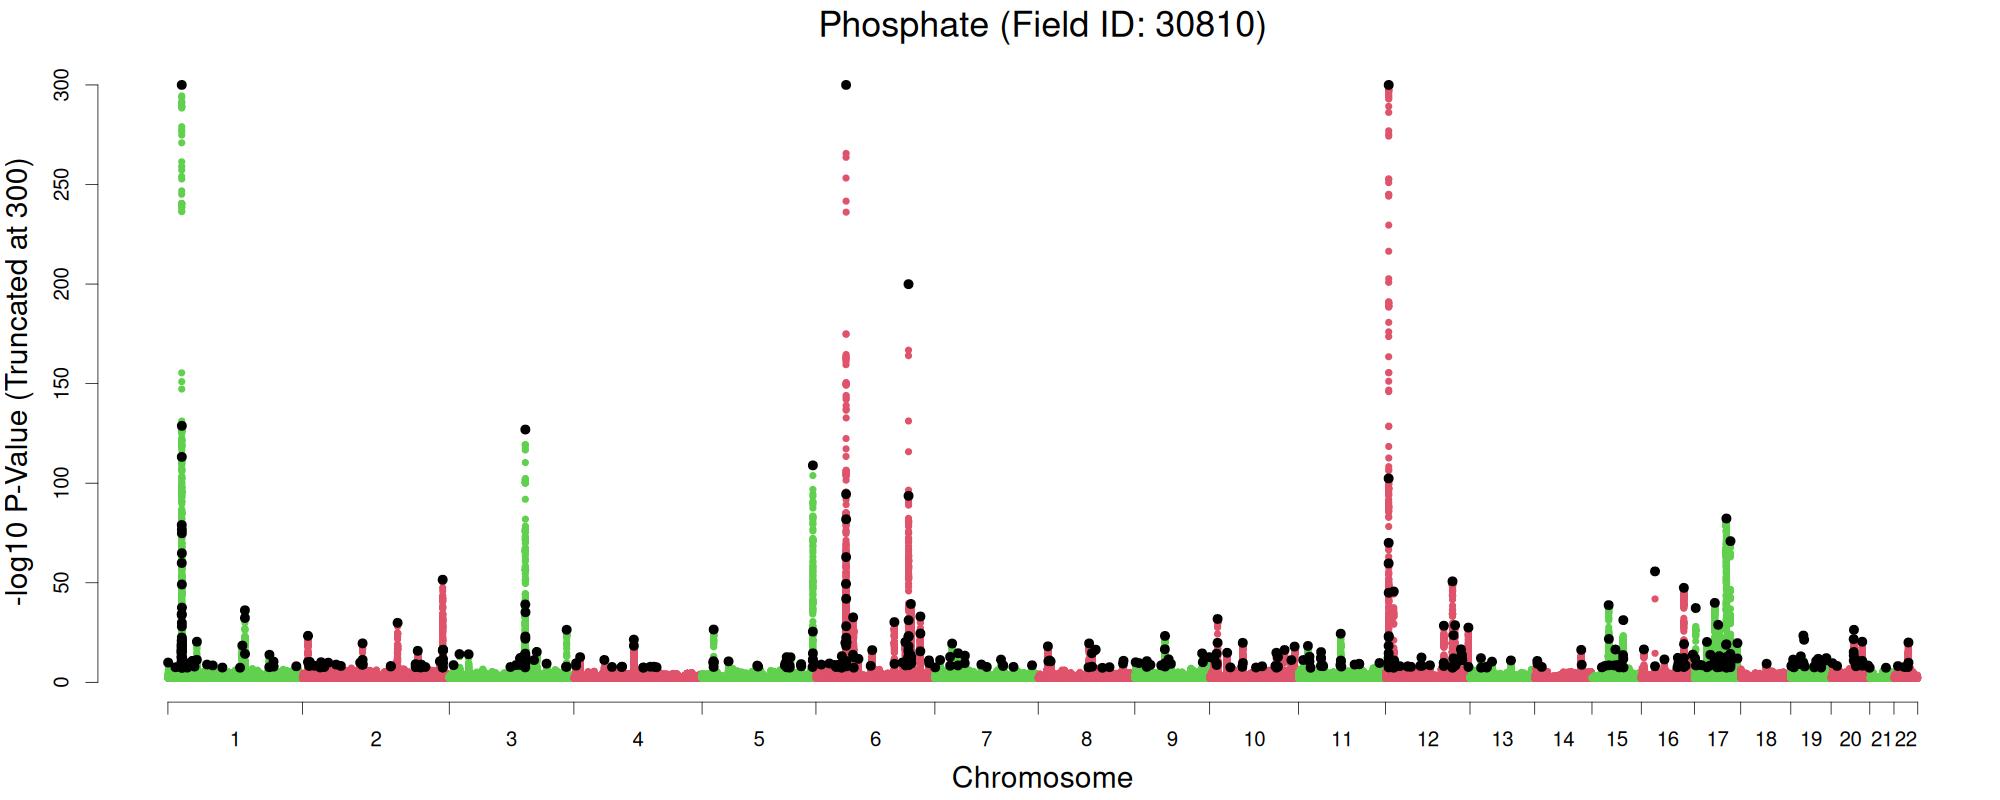
| 44 | Phosphate | 30810 | 400020 | 0.158 | 30267 | 494 | 0.082 | Manhattan | Summary Stats | PGS Weights |
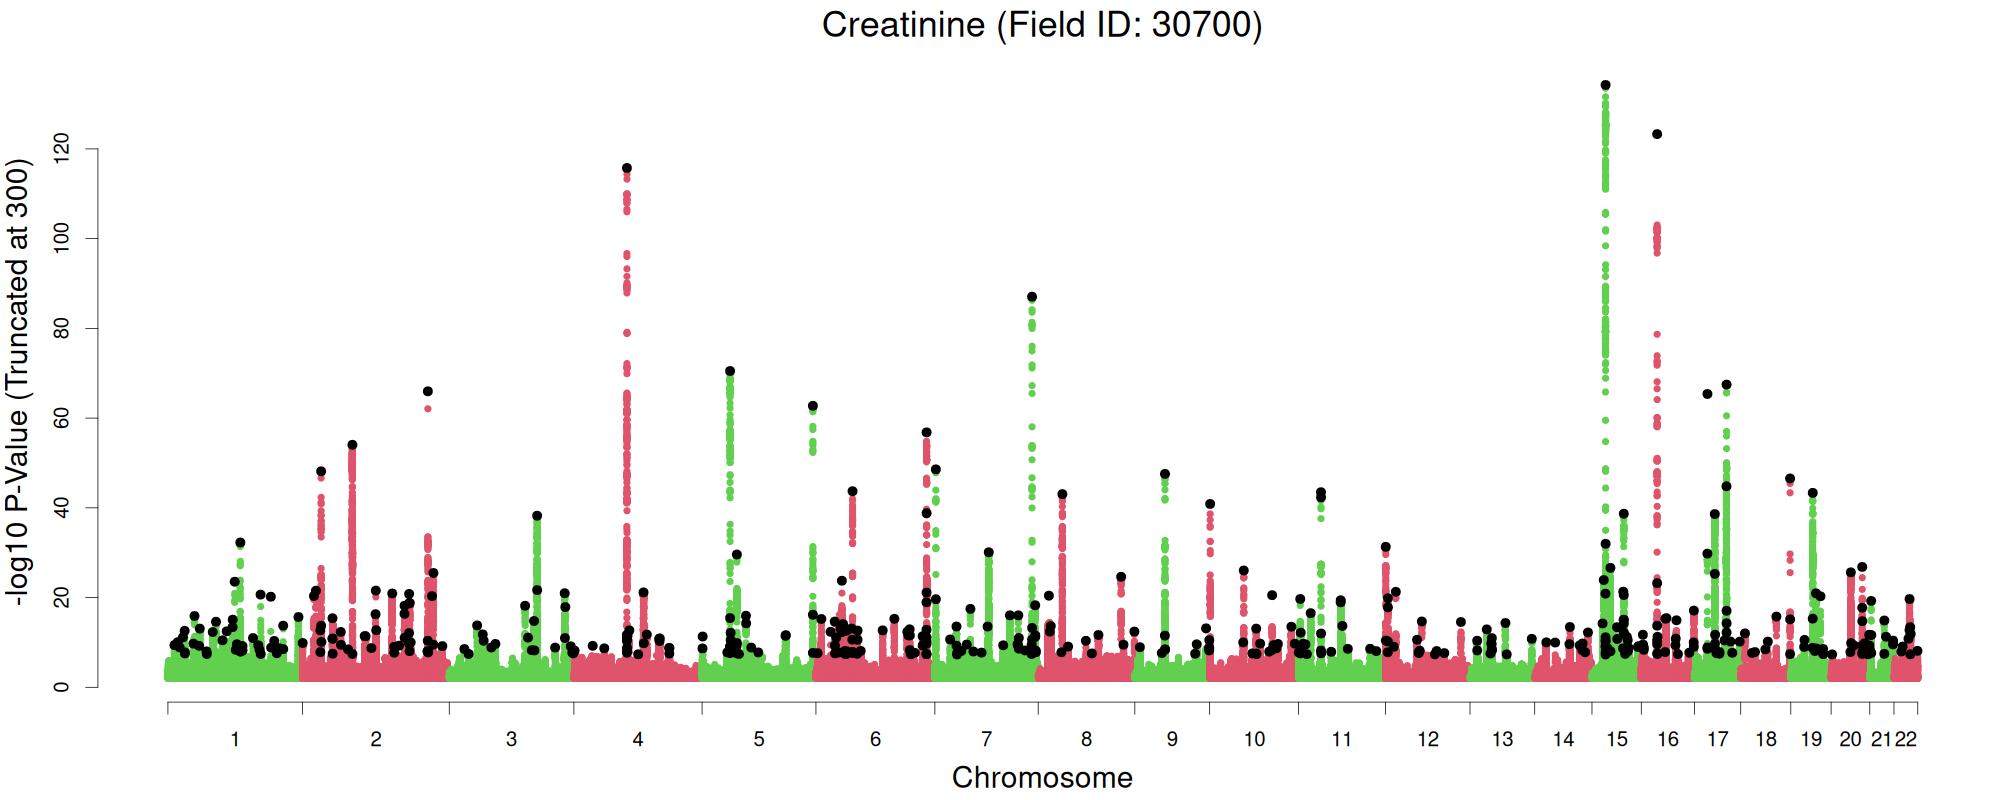
| 45 | Creatinine | 30700 | 437506 | 0.15 | 37063 | 465 | 0.07 | Manhattan | Summary Stats | PGS Weights |
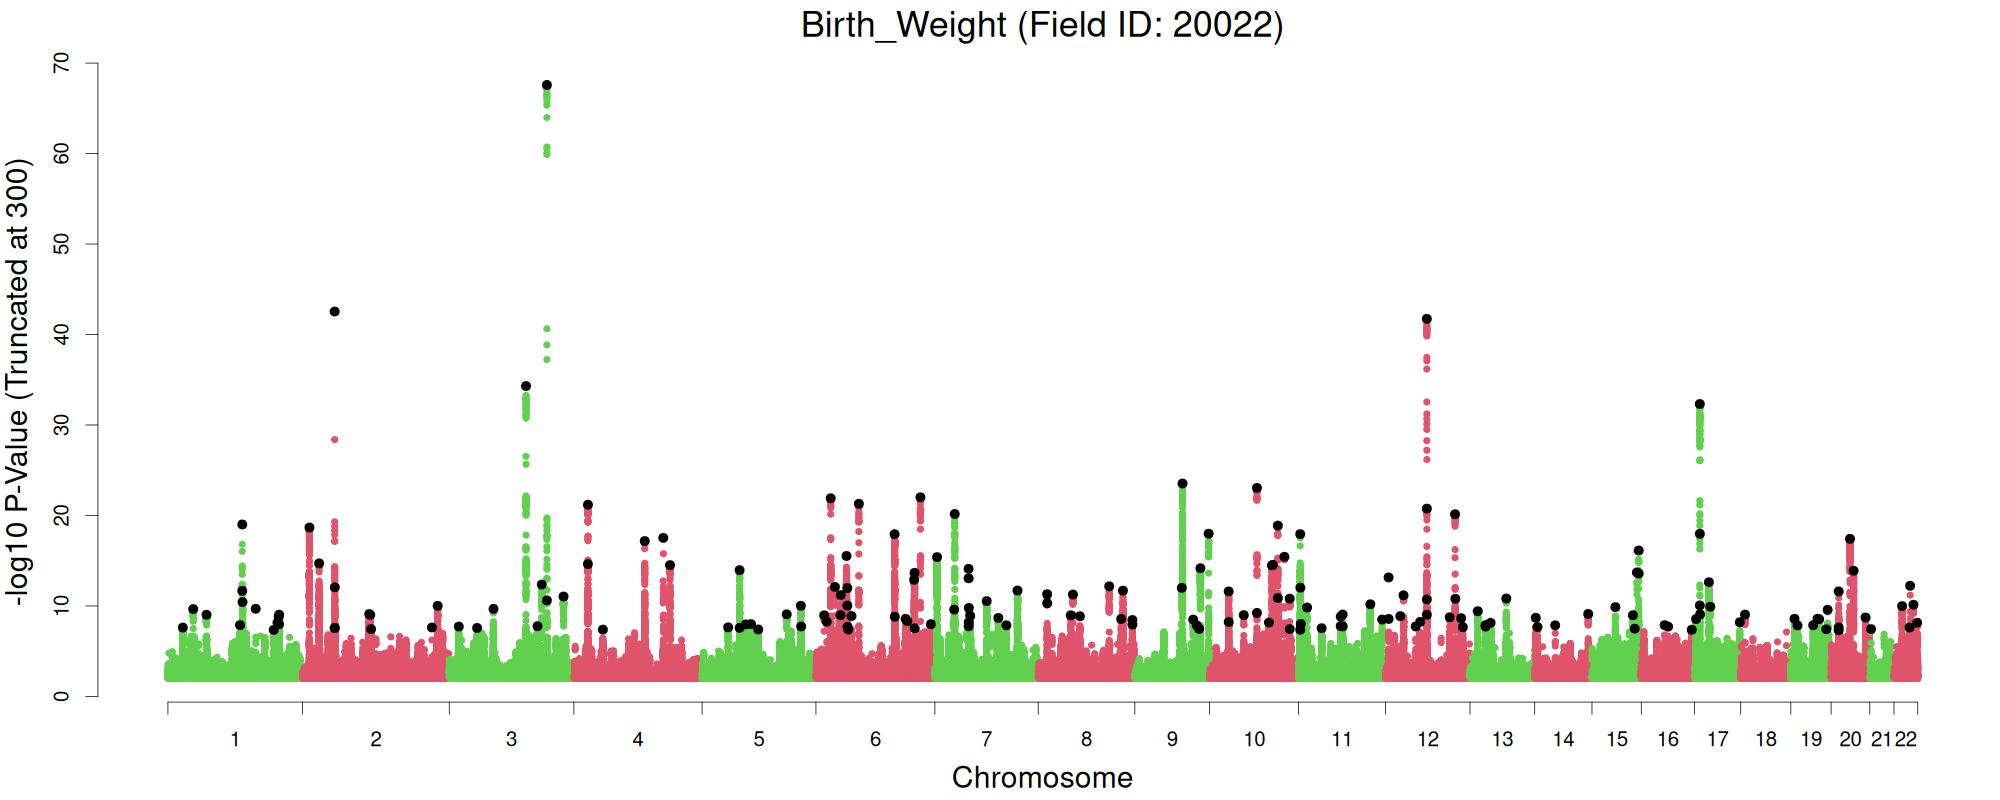
| 46 | Birth Weight | 20022 | 260240 | 0.147 | 8350 | 182 | 0.046 | Manhattan | Summary Stats | PGS Weights |
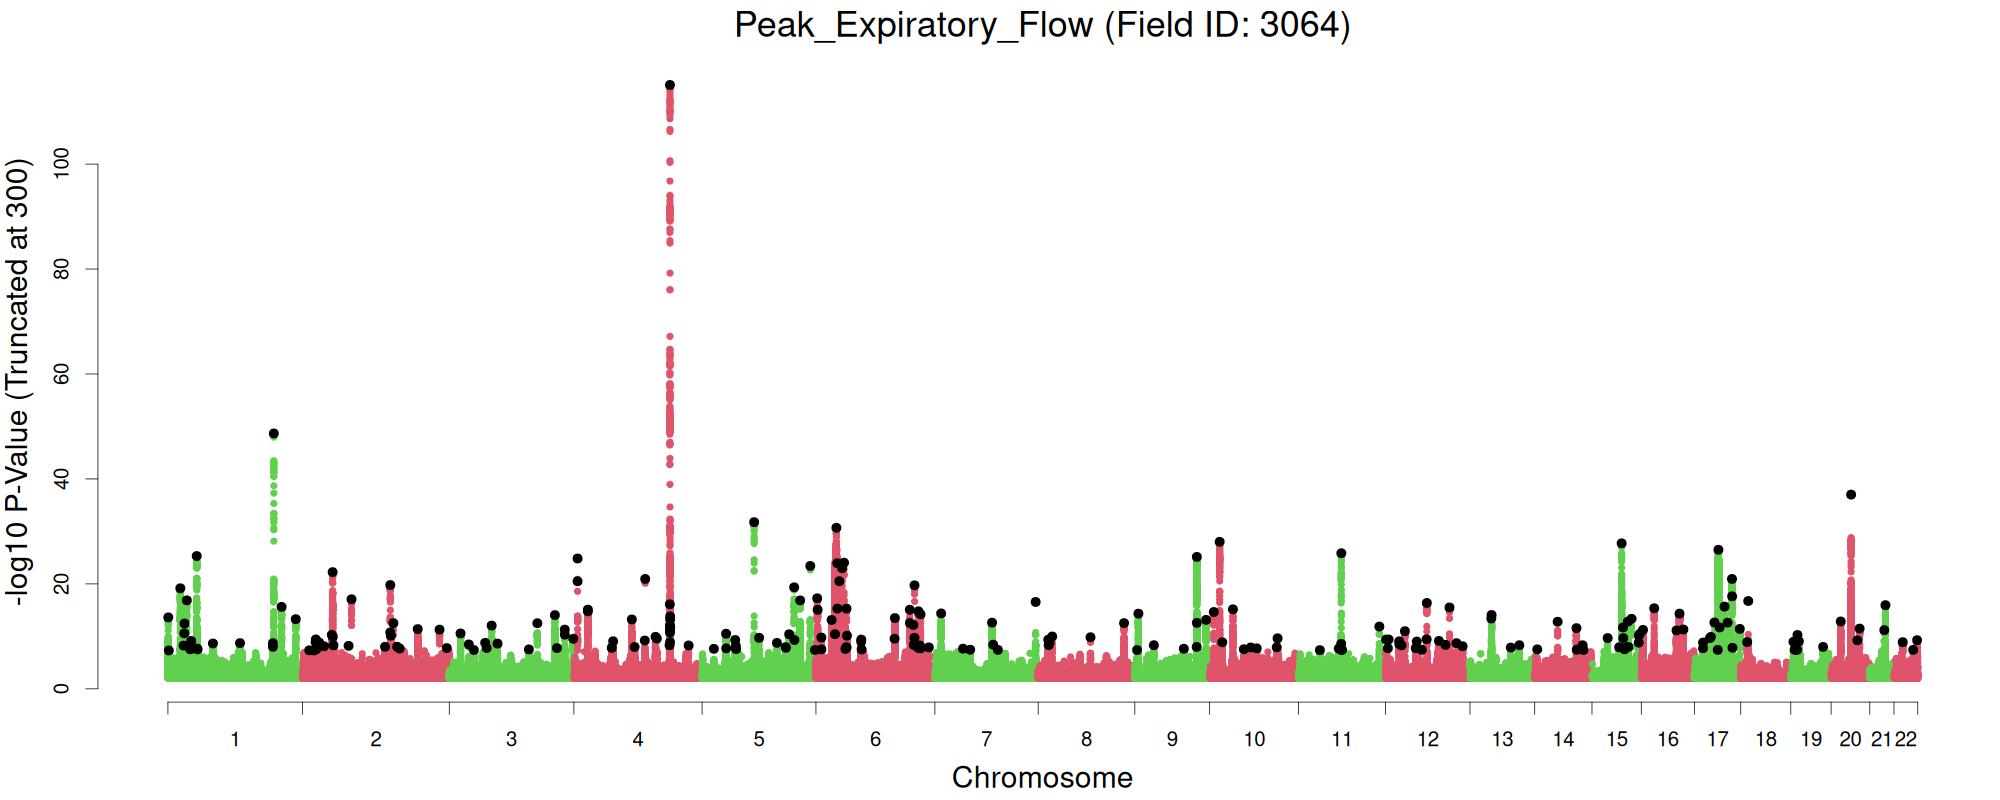
| 47 | Peak Expiratory Flow | 3064 | 418461 | 0.141 | 28176 | 245 | 0.048 | Manhattan | Summary Stats | PGS Weights |
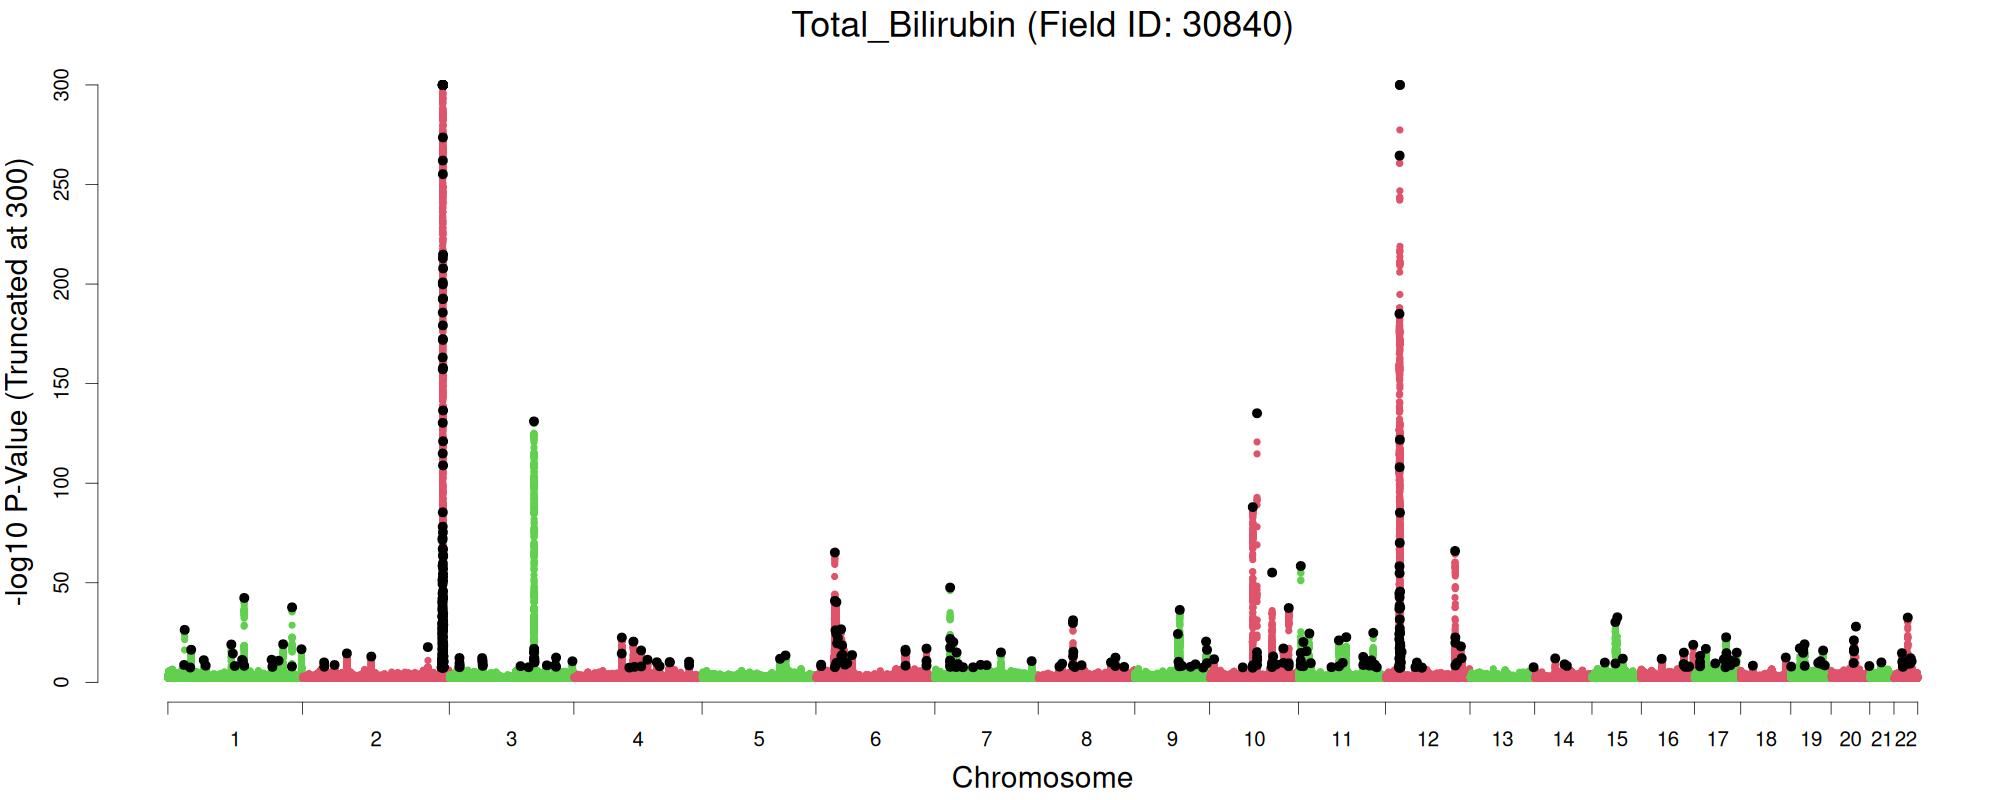
| 48 | Total Bilirubin | 30840 | 435902 | 0.138 | 37402 | 462 | 0.337 | Manhattan | Summary Stats | PGS Weights |
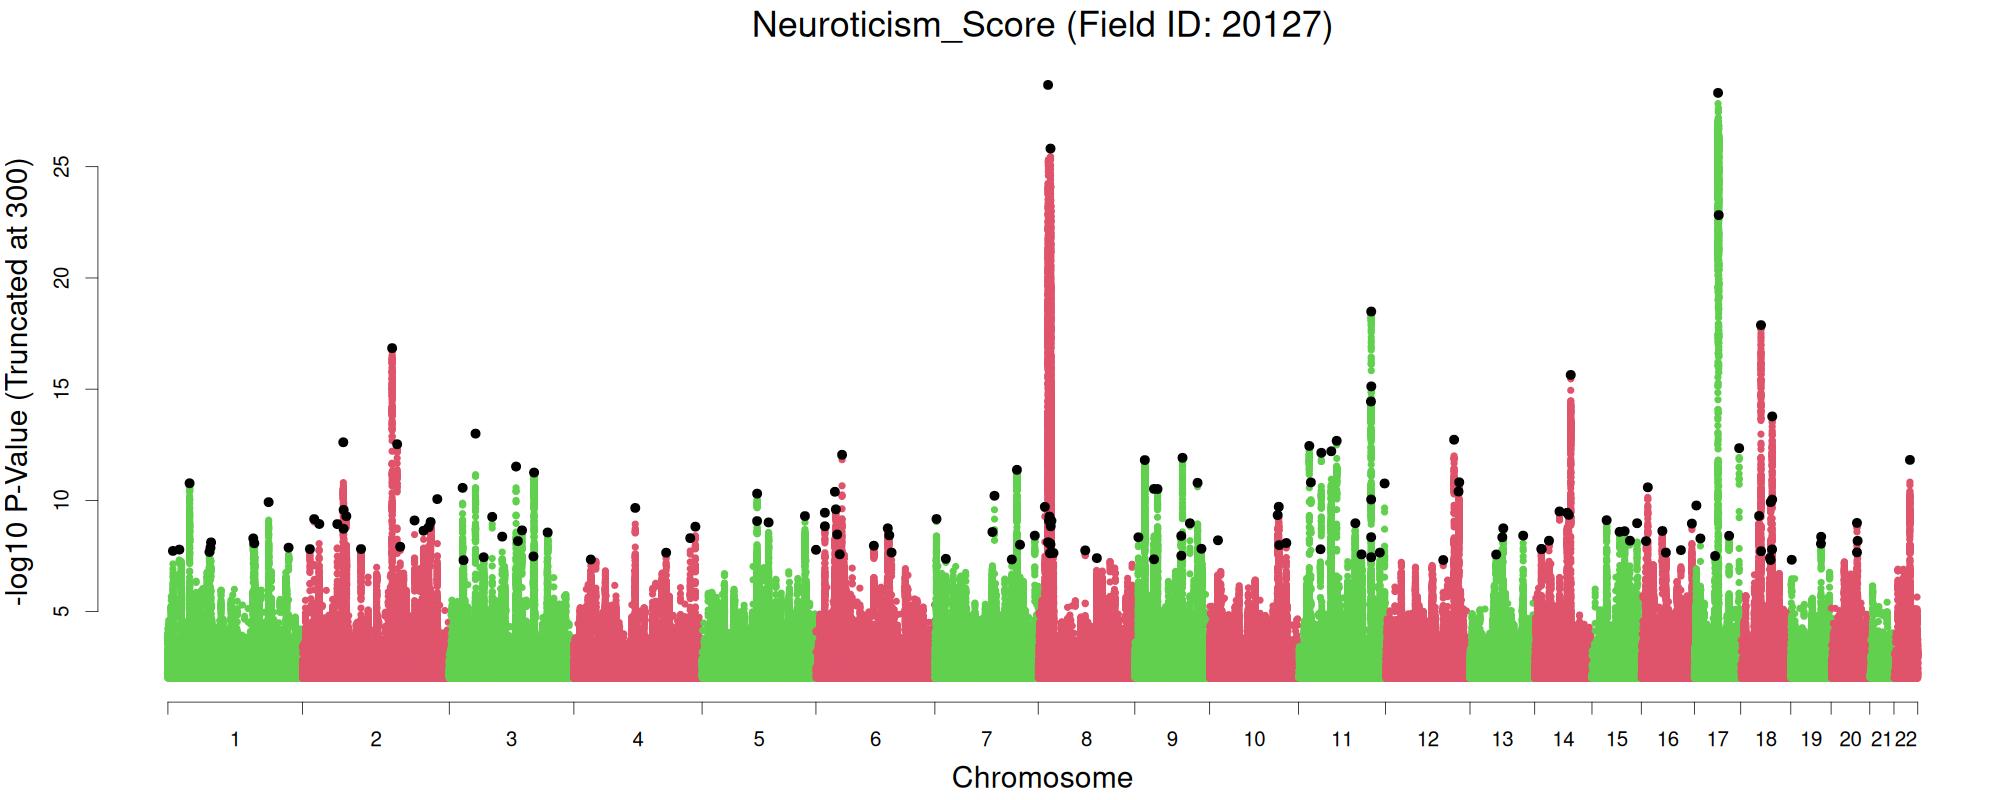
| 49 | Neuroticism Score | 20127 | 371892 | 0.136 | 16158 | 158 | 0.042 | Manhattan | Summary Stats | PGS Weights |
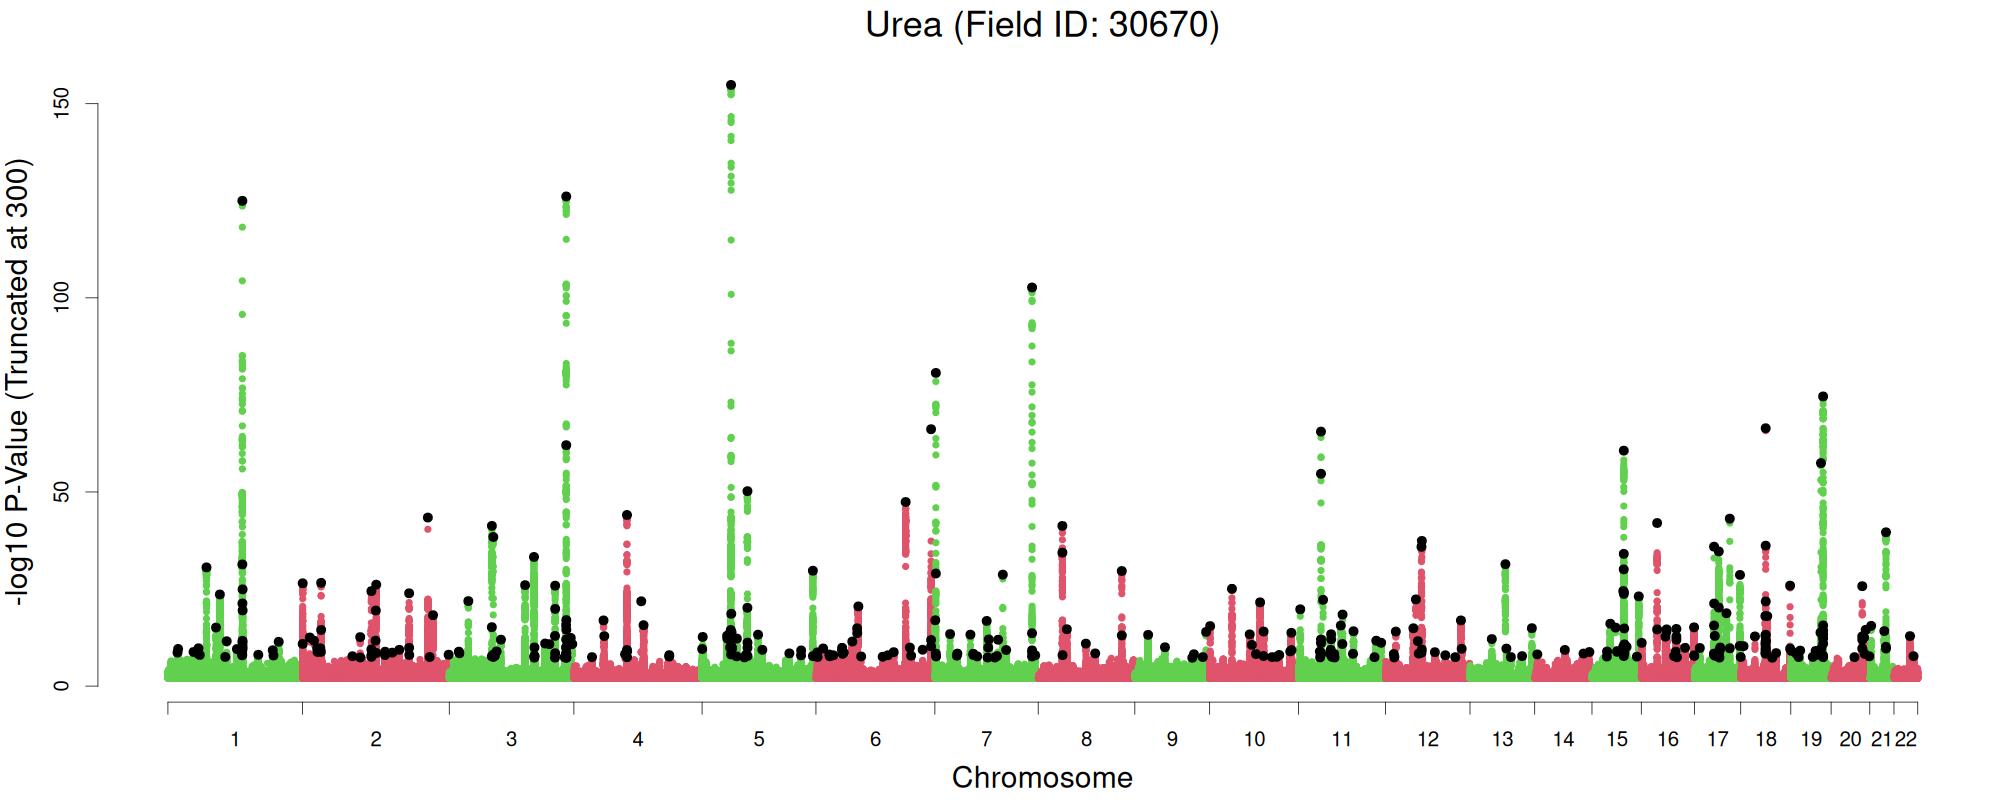
| 50 | Urea | 30670 | 437426 | 0.134 | 25271 | 390 | 0.059 | Manhattan | Summary Stats | PGS Weights |
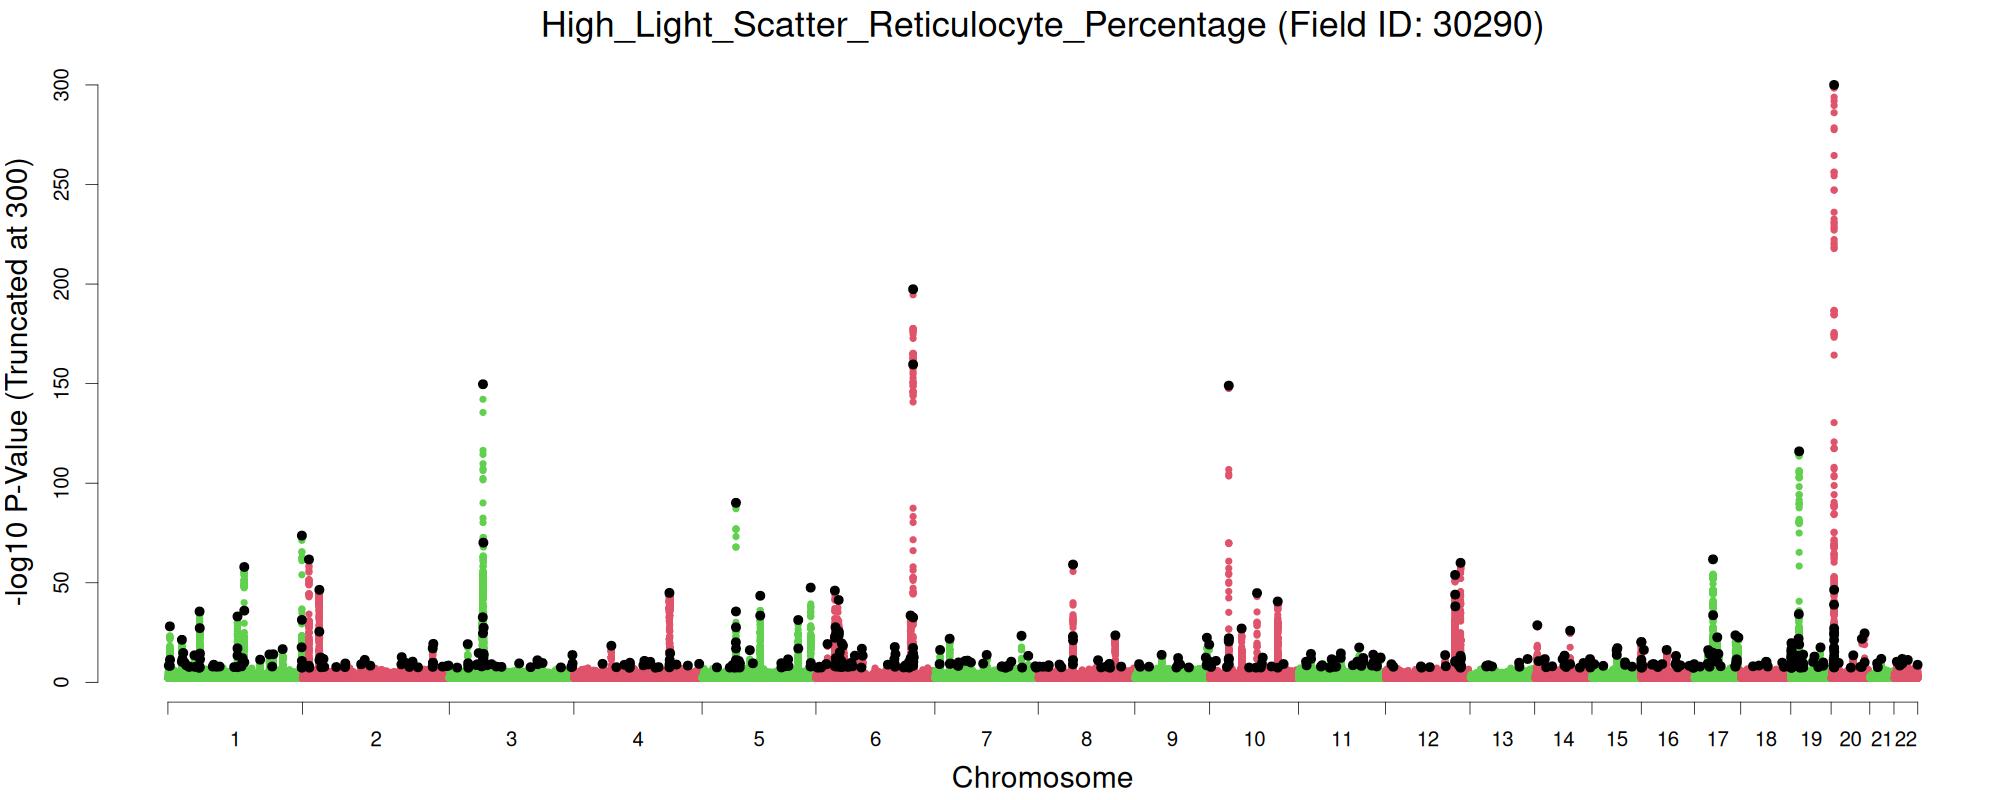
| 51 | High Light Scatter Reticulocyte Percentage | 30290 | 438083 | 0.13 | 34443 | 521 | 0.106 | Manhattan | Summary Stats | PGS Weights |
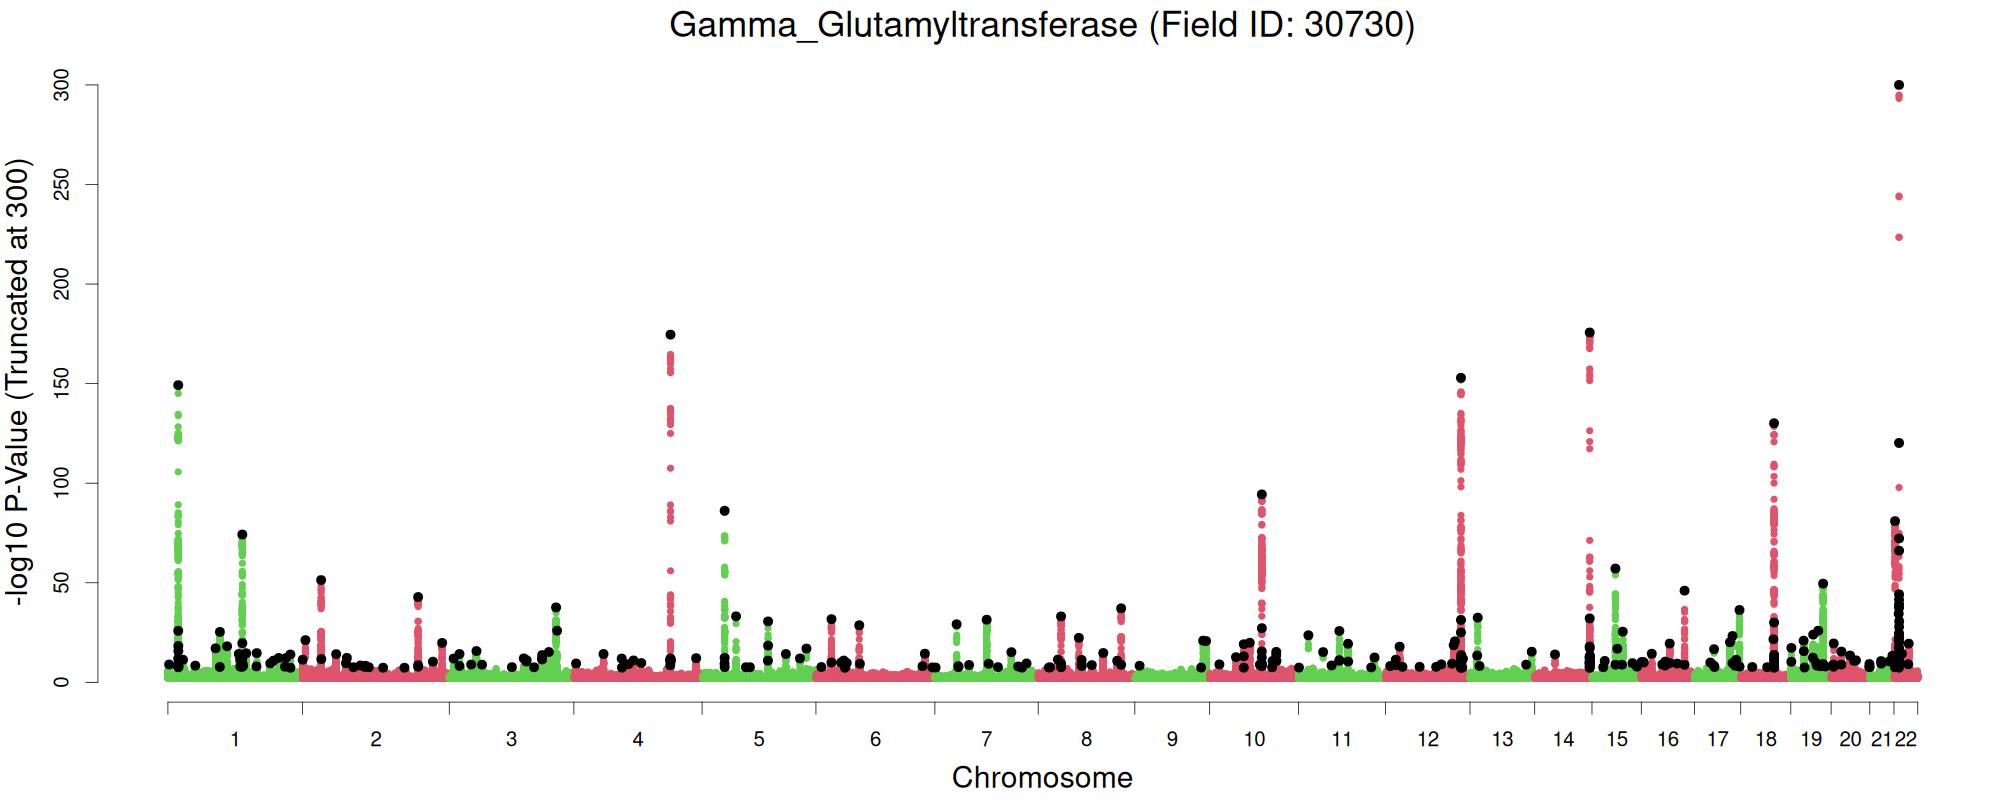
| 52 | Gamma Glutamyltransferase | 30730 | 437497 | 0.116 | 17921 | 343 | 0.05 | Manhattan | Summary Stats | PGS Weights |
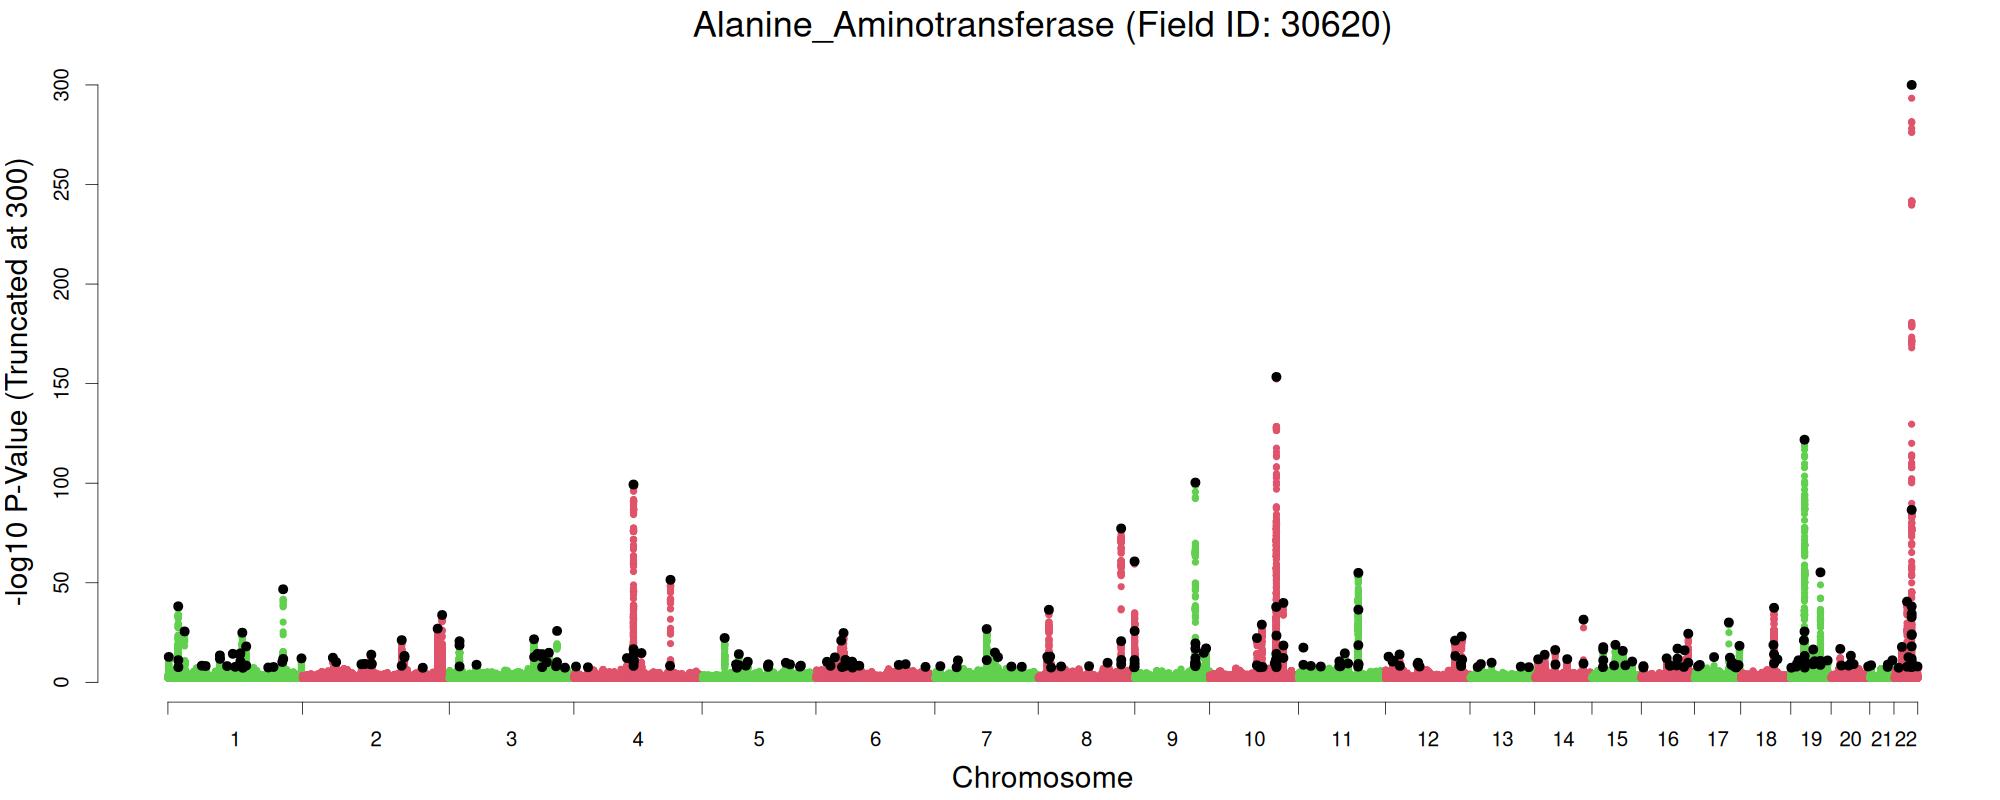
| 53 | Alanine Aminotransferase | 30620 | 437570 | 0.114 | 19036 | 296 | 0.046 | Manhattan | Summary Stats | PGS Weights |
| 54 | Age Completed Full Time Education | 845 | 306405 | 0.103 | 783 | 18 | 0.02 | Manhattan | Summary Stats | PGS Weights |
| 55 | Sodium in Urine | 30530 | 444931 | 0.101 | 4076 | 72 | 0.023 | Manhattan | Summary Stats | PGS Weights |
| 56 | C-reactive Protein | 30710 | 436785 | 0.092 | 12209 | 161 | 0.03 | Manhattan | Summary Stats | PGS Weights |
| 57 | Mean Time to Correctly Identify Matches | 20023 | 455994 | 0.083 | 3950 | 66 | 0.022 | Manhattan | Summary Stats | PGS Weights |
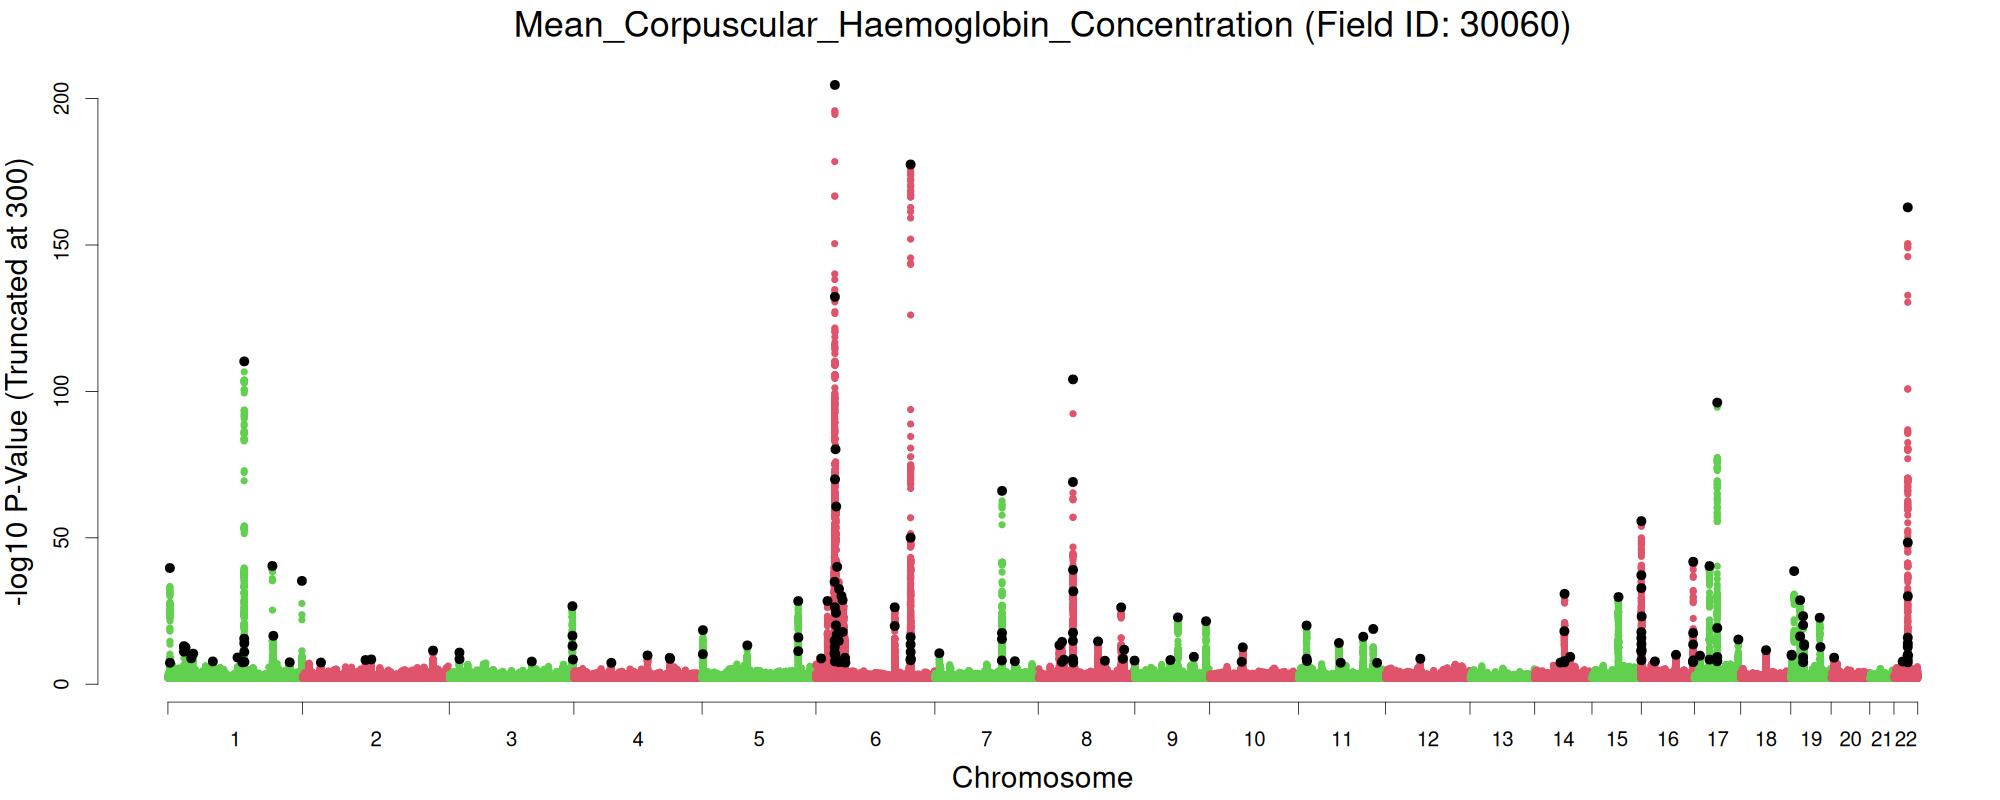
| 58 | Mean Corpuscular Haemoglobin Concentration | 30060 | 445361 | 0.077 | 25263 | 179 | 0.025 | Manhattan | Summary Stats | PGS Weights |
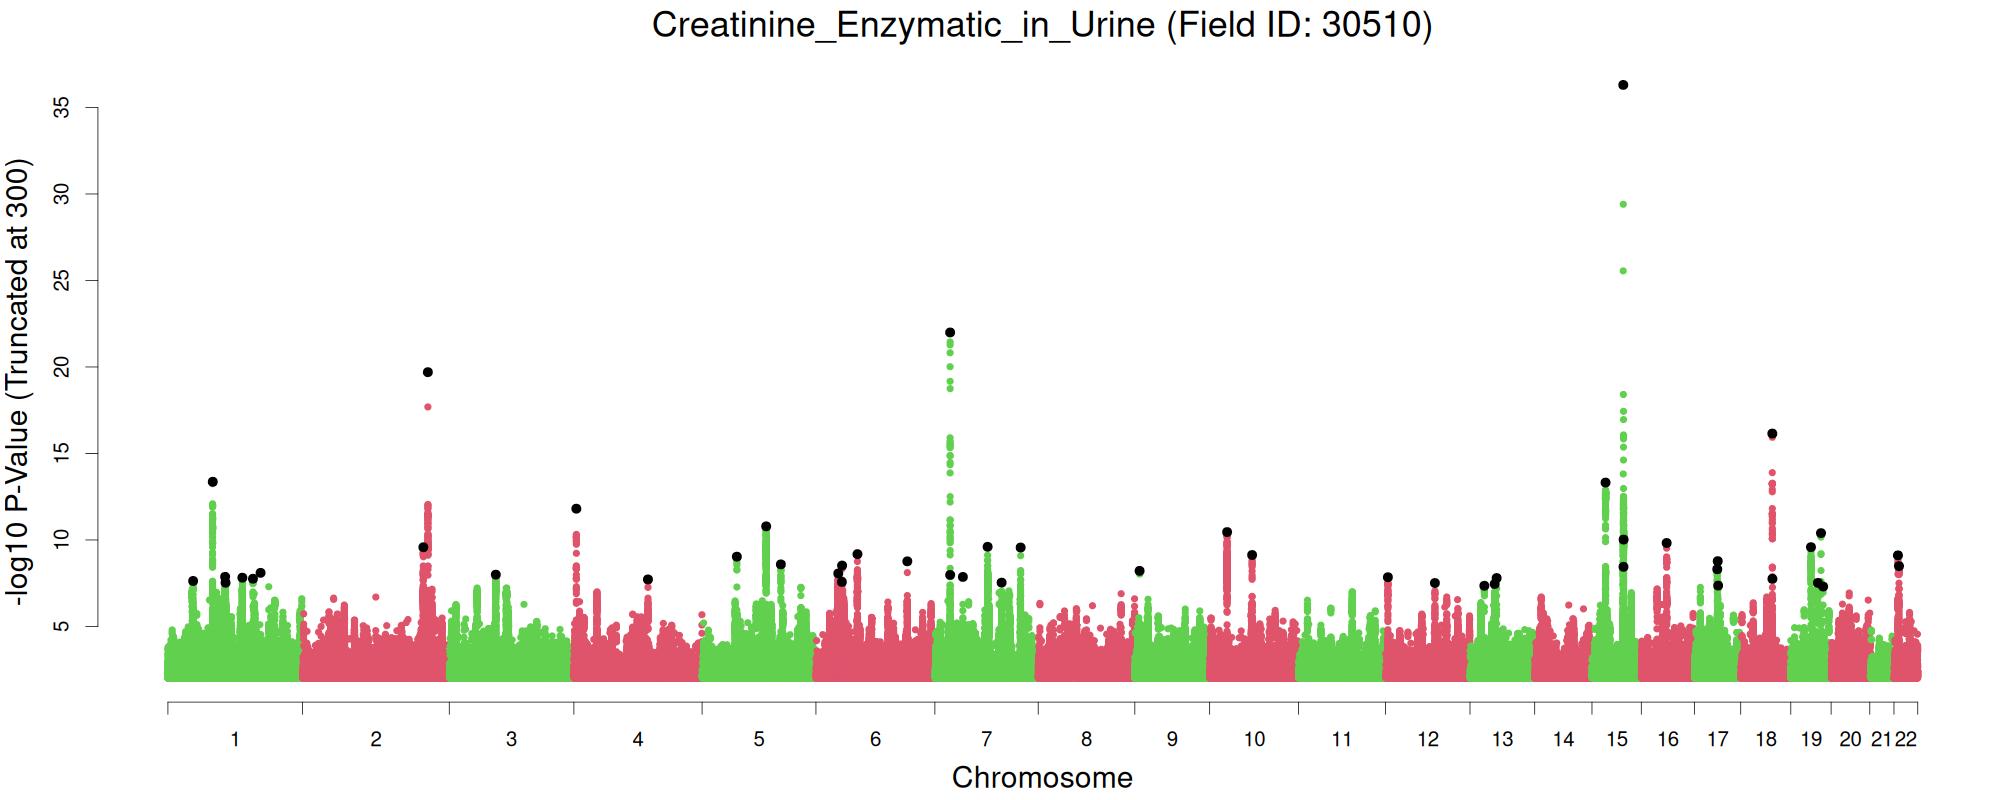
| 59 | Creatinine Enzymatic in Urine | 30510 | 445891 | 0.074 | 1737 | 49 | 0.017 | Manhattan | Summary Stats | PGS Weights |
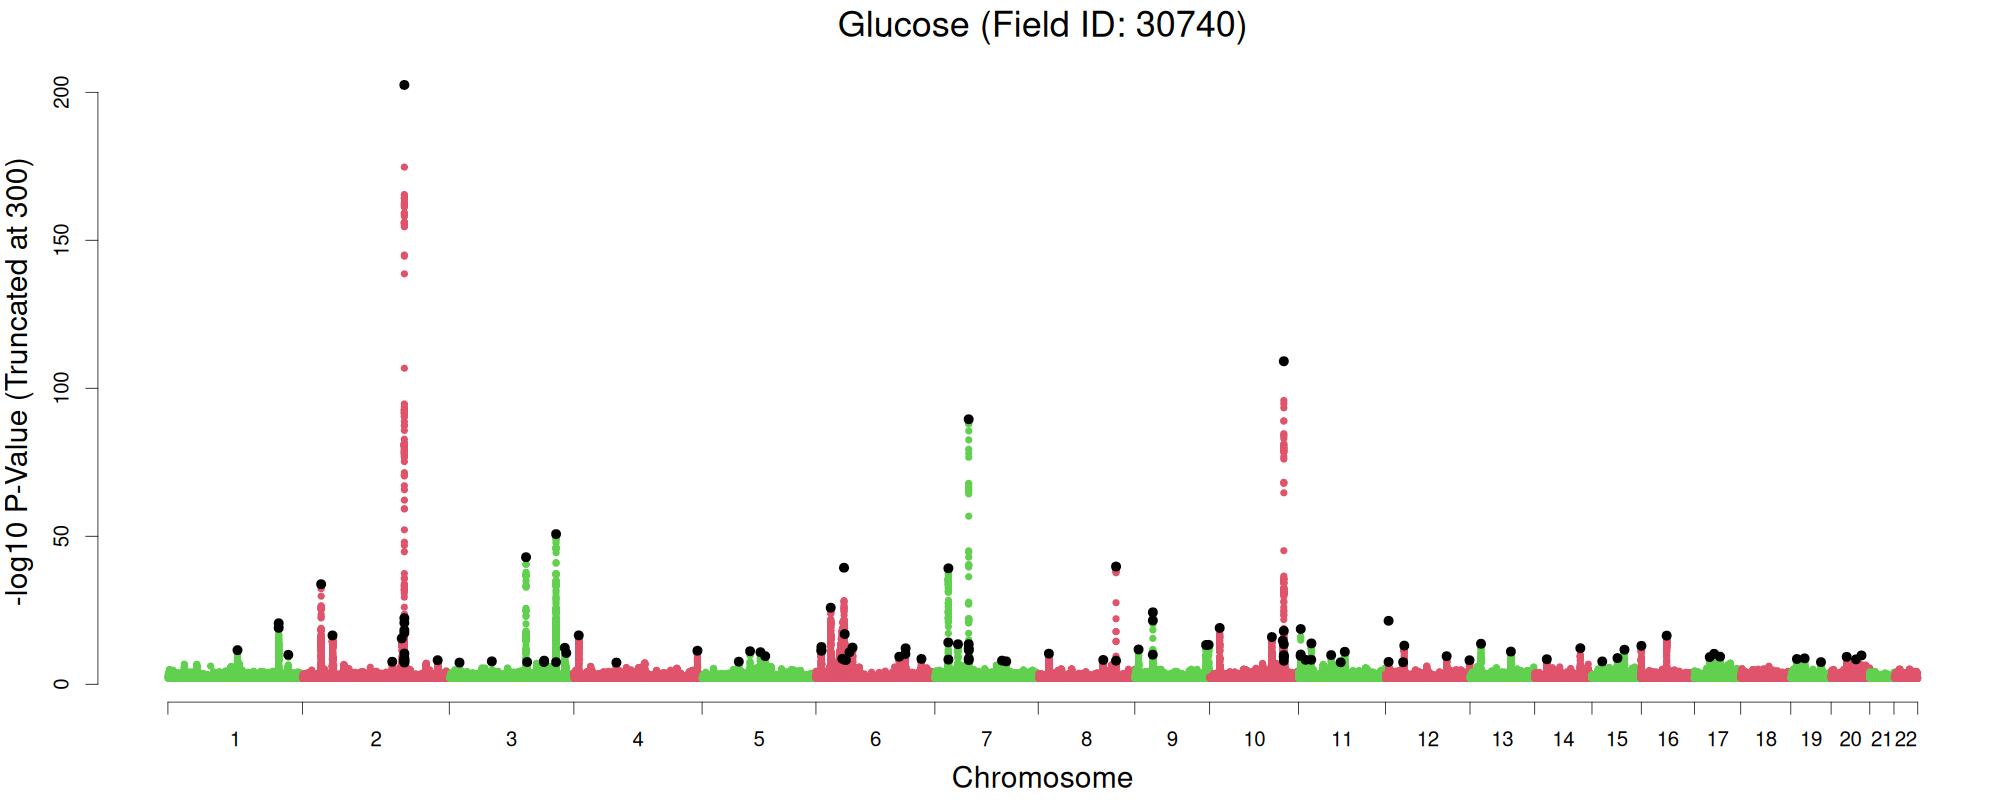
| 60 | Glucose | 30740 | 400319 | 0.065 | 10592 | 116 | 0.021 | Manhattan | Summary Stats | PGS Weights |
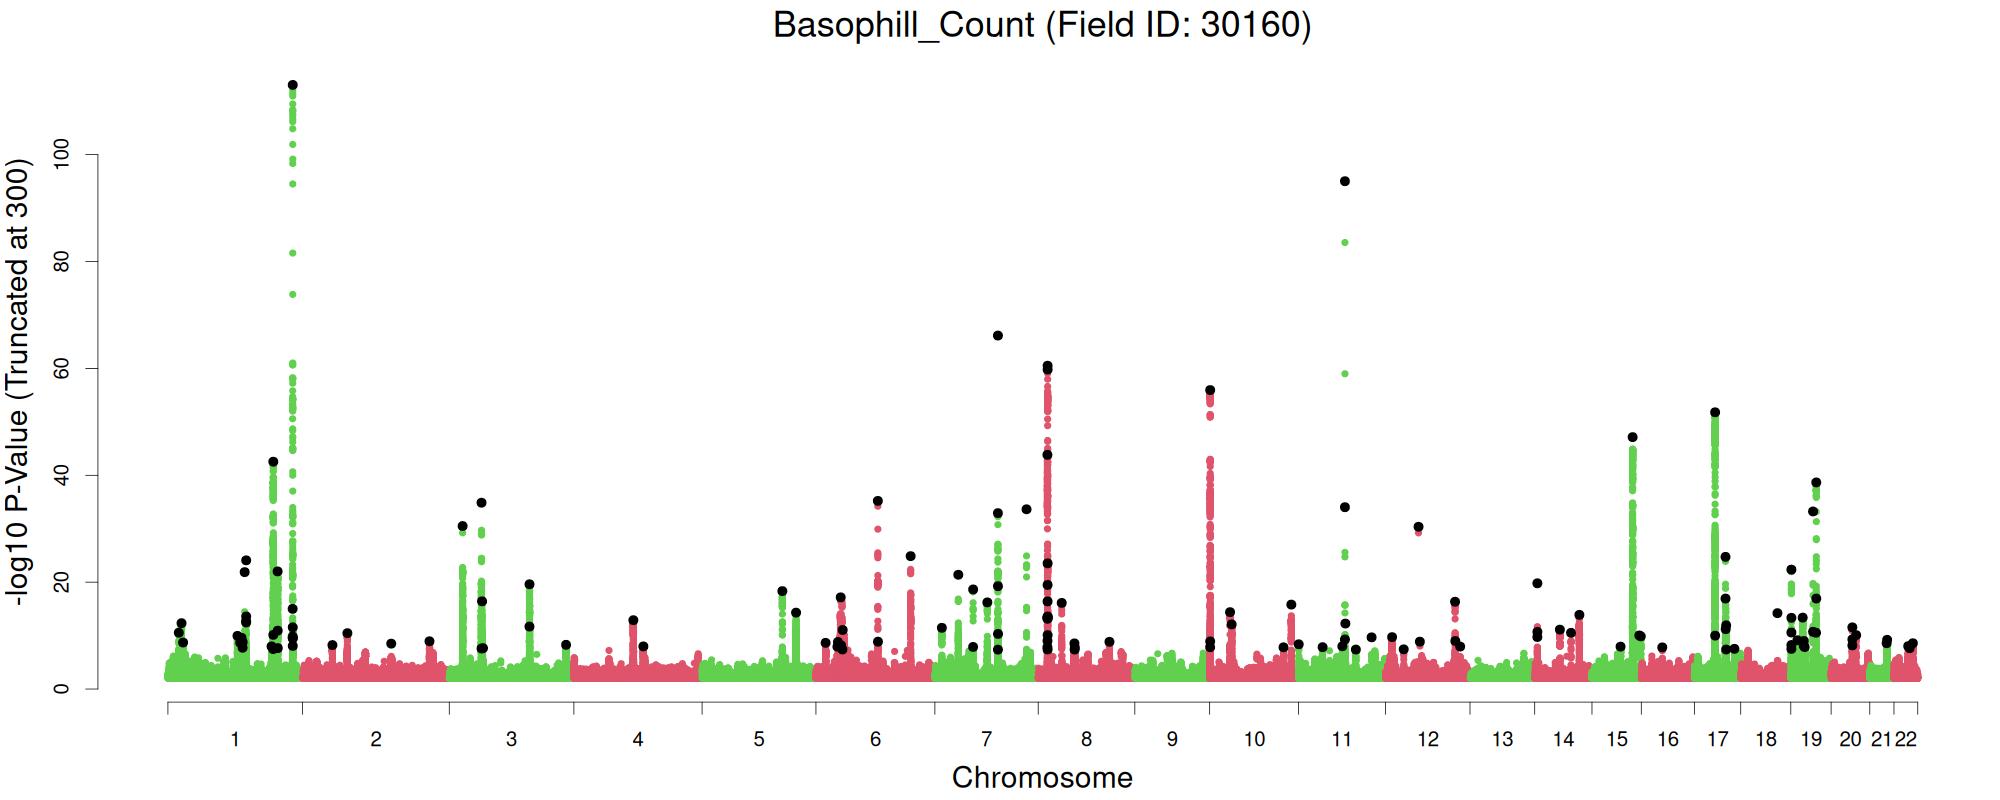
| 61 | Basophill Count | 30160 | 444571 | 0.056 | 9851 | 146 | 0.021 | Manhattan | Summary Stats | PGS Weights |
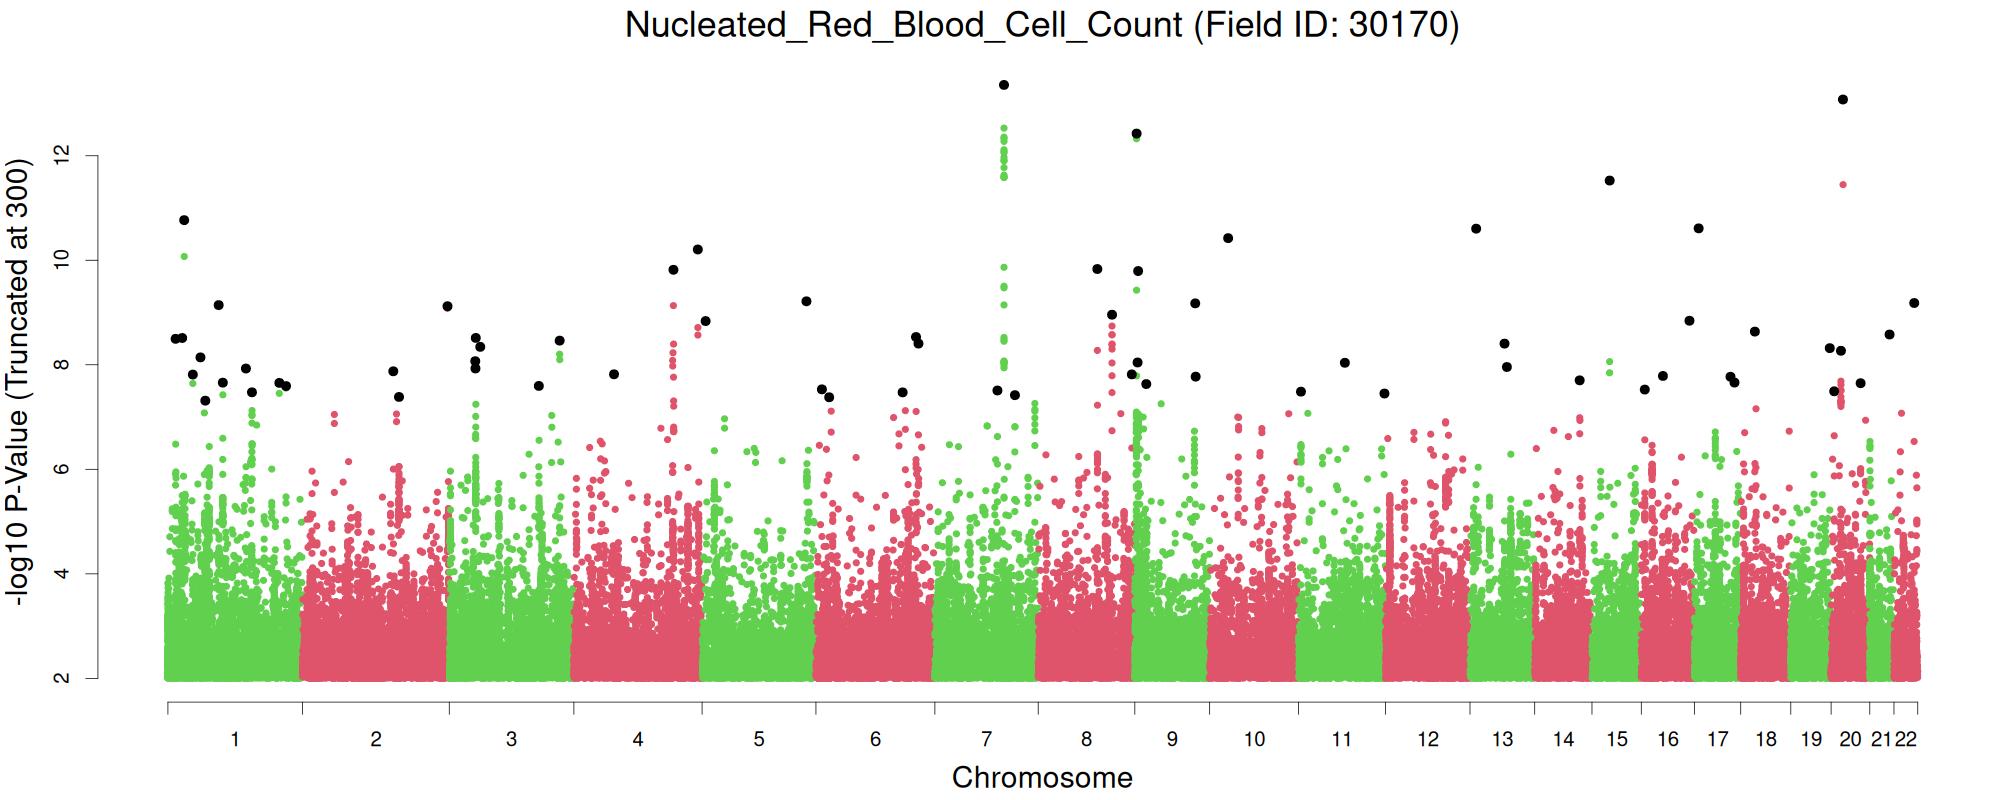
| 62 | Nucleated Red Blood Cell Count | 30170 | 444561 | 0.01 | 138 | 63 | 0 | Manhattan | Summary Stats | PGS Weights |