Performance of LDAK-KVIK
We assessed the performance of LDAK-KVIK based on run time, type 1 error and power using both simulated data and data from the UK Biobank.
Computational costs
We compared the run time and memory requirements of LDAK-KVIK with those of REGENIE when applied to 690k SNPs, using various sample sizes.
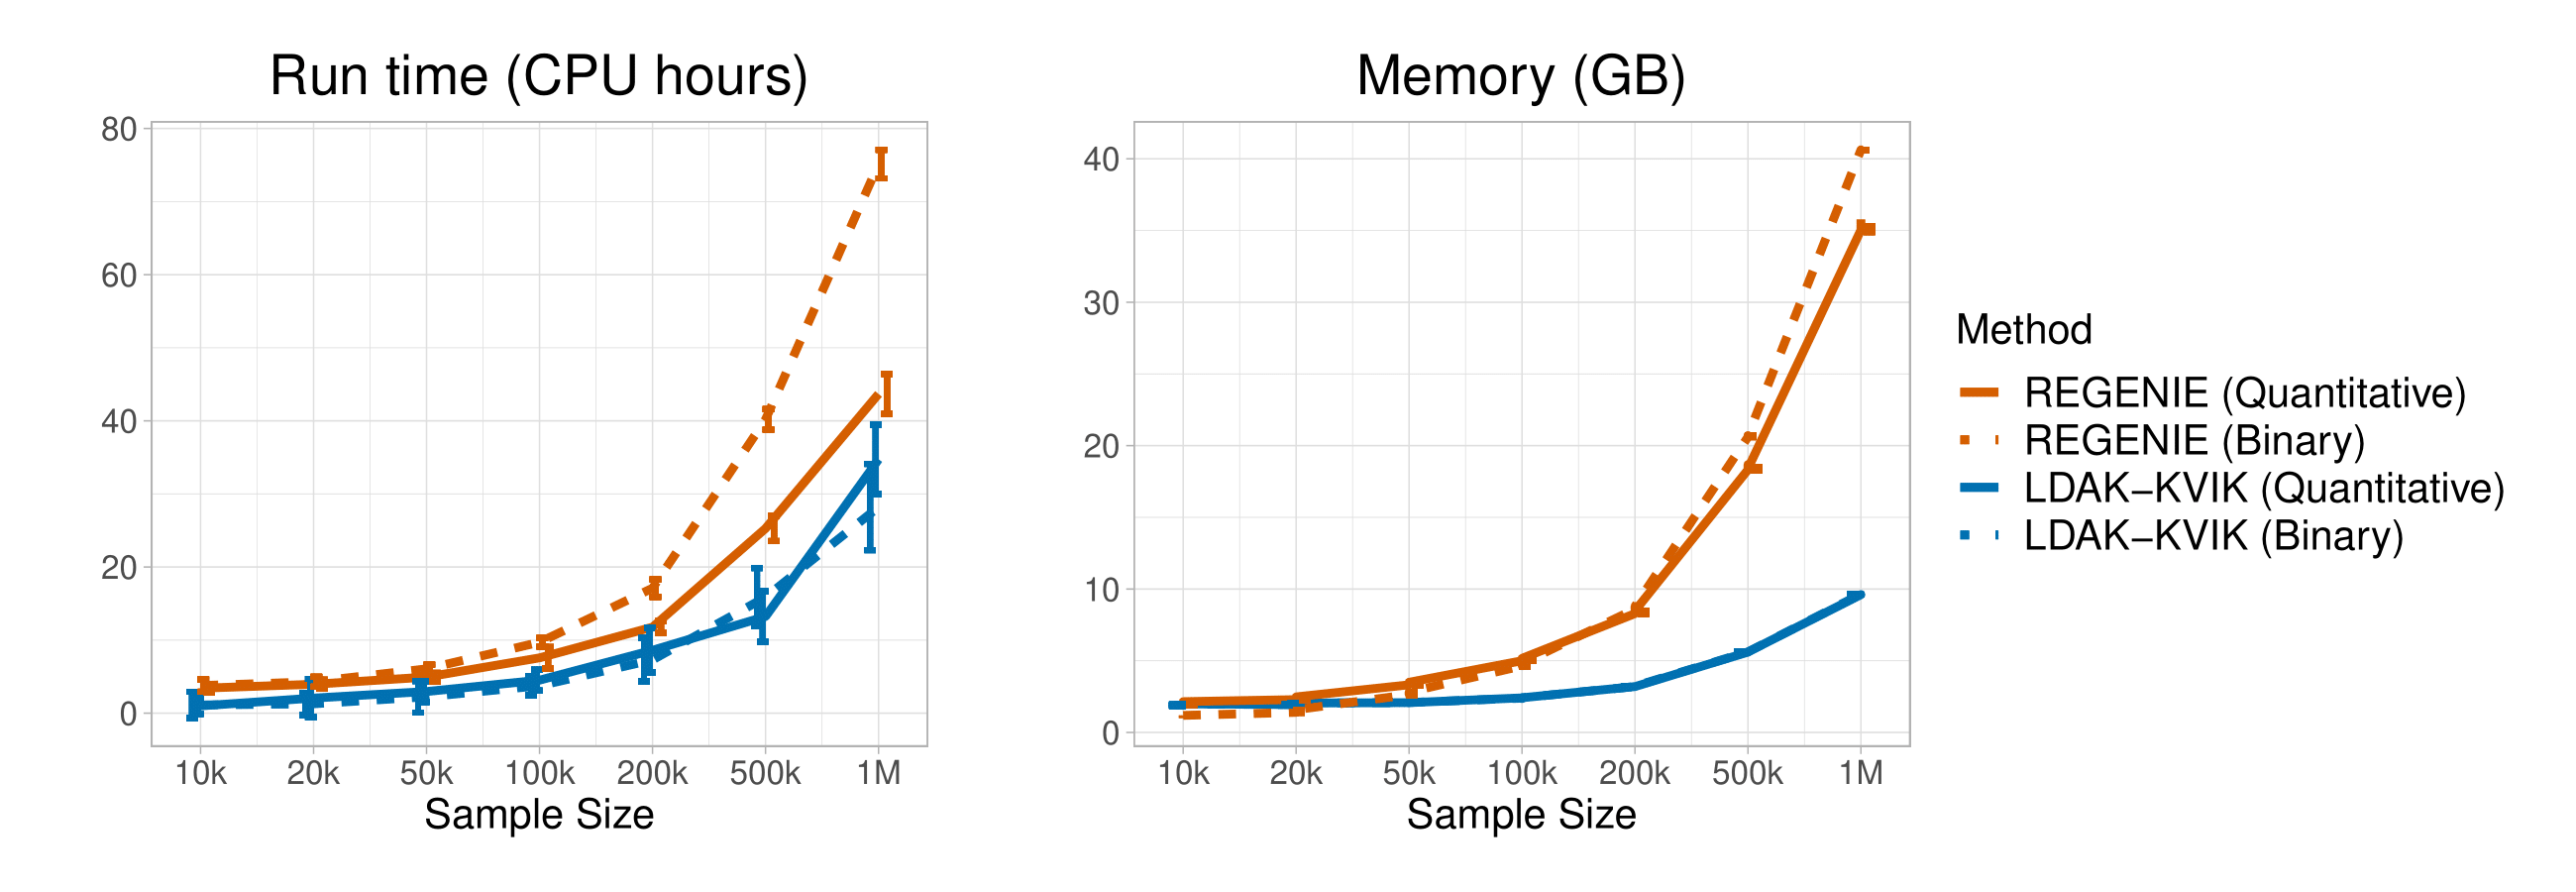
These results indicate that it is feasible to apply LDAK-KVIK to very large datasets (e.g., a million individuals). In general, we find that LDAK-KVIK is faster than REGENIE for all sample sizes, and for both quantitative and binary phenotypes. While the two tools have similar memory requirements for small samples sizes, LDAK-KVIK uses noticeably less memory than REGENIE for larger sample sizes (e.g., more than 50k individuals).
Application to UK Biobank
Single-SNP analysis
We applied LDAK-KVIK to 40 quantiative traits from the UK Biobank, and compared its performance to BOLT-LMM, Regenie, fastGWA, and classical regression. For every trait, we evaluated the number of independent significantly associated loci for each method, and compared those the number of significant loci obtained using fastGWA (left plot). We also compared the mean chi squared statistics of SNPs that were significant in linear regression, relative to fastGWA (right plot). These relative differences are plotted against the estimated SNP heritability of the trait.
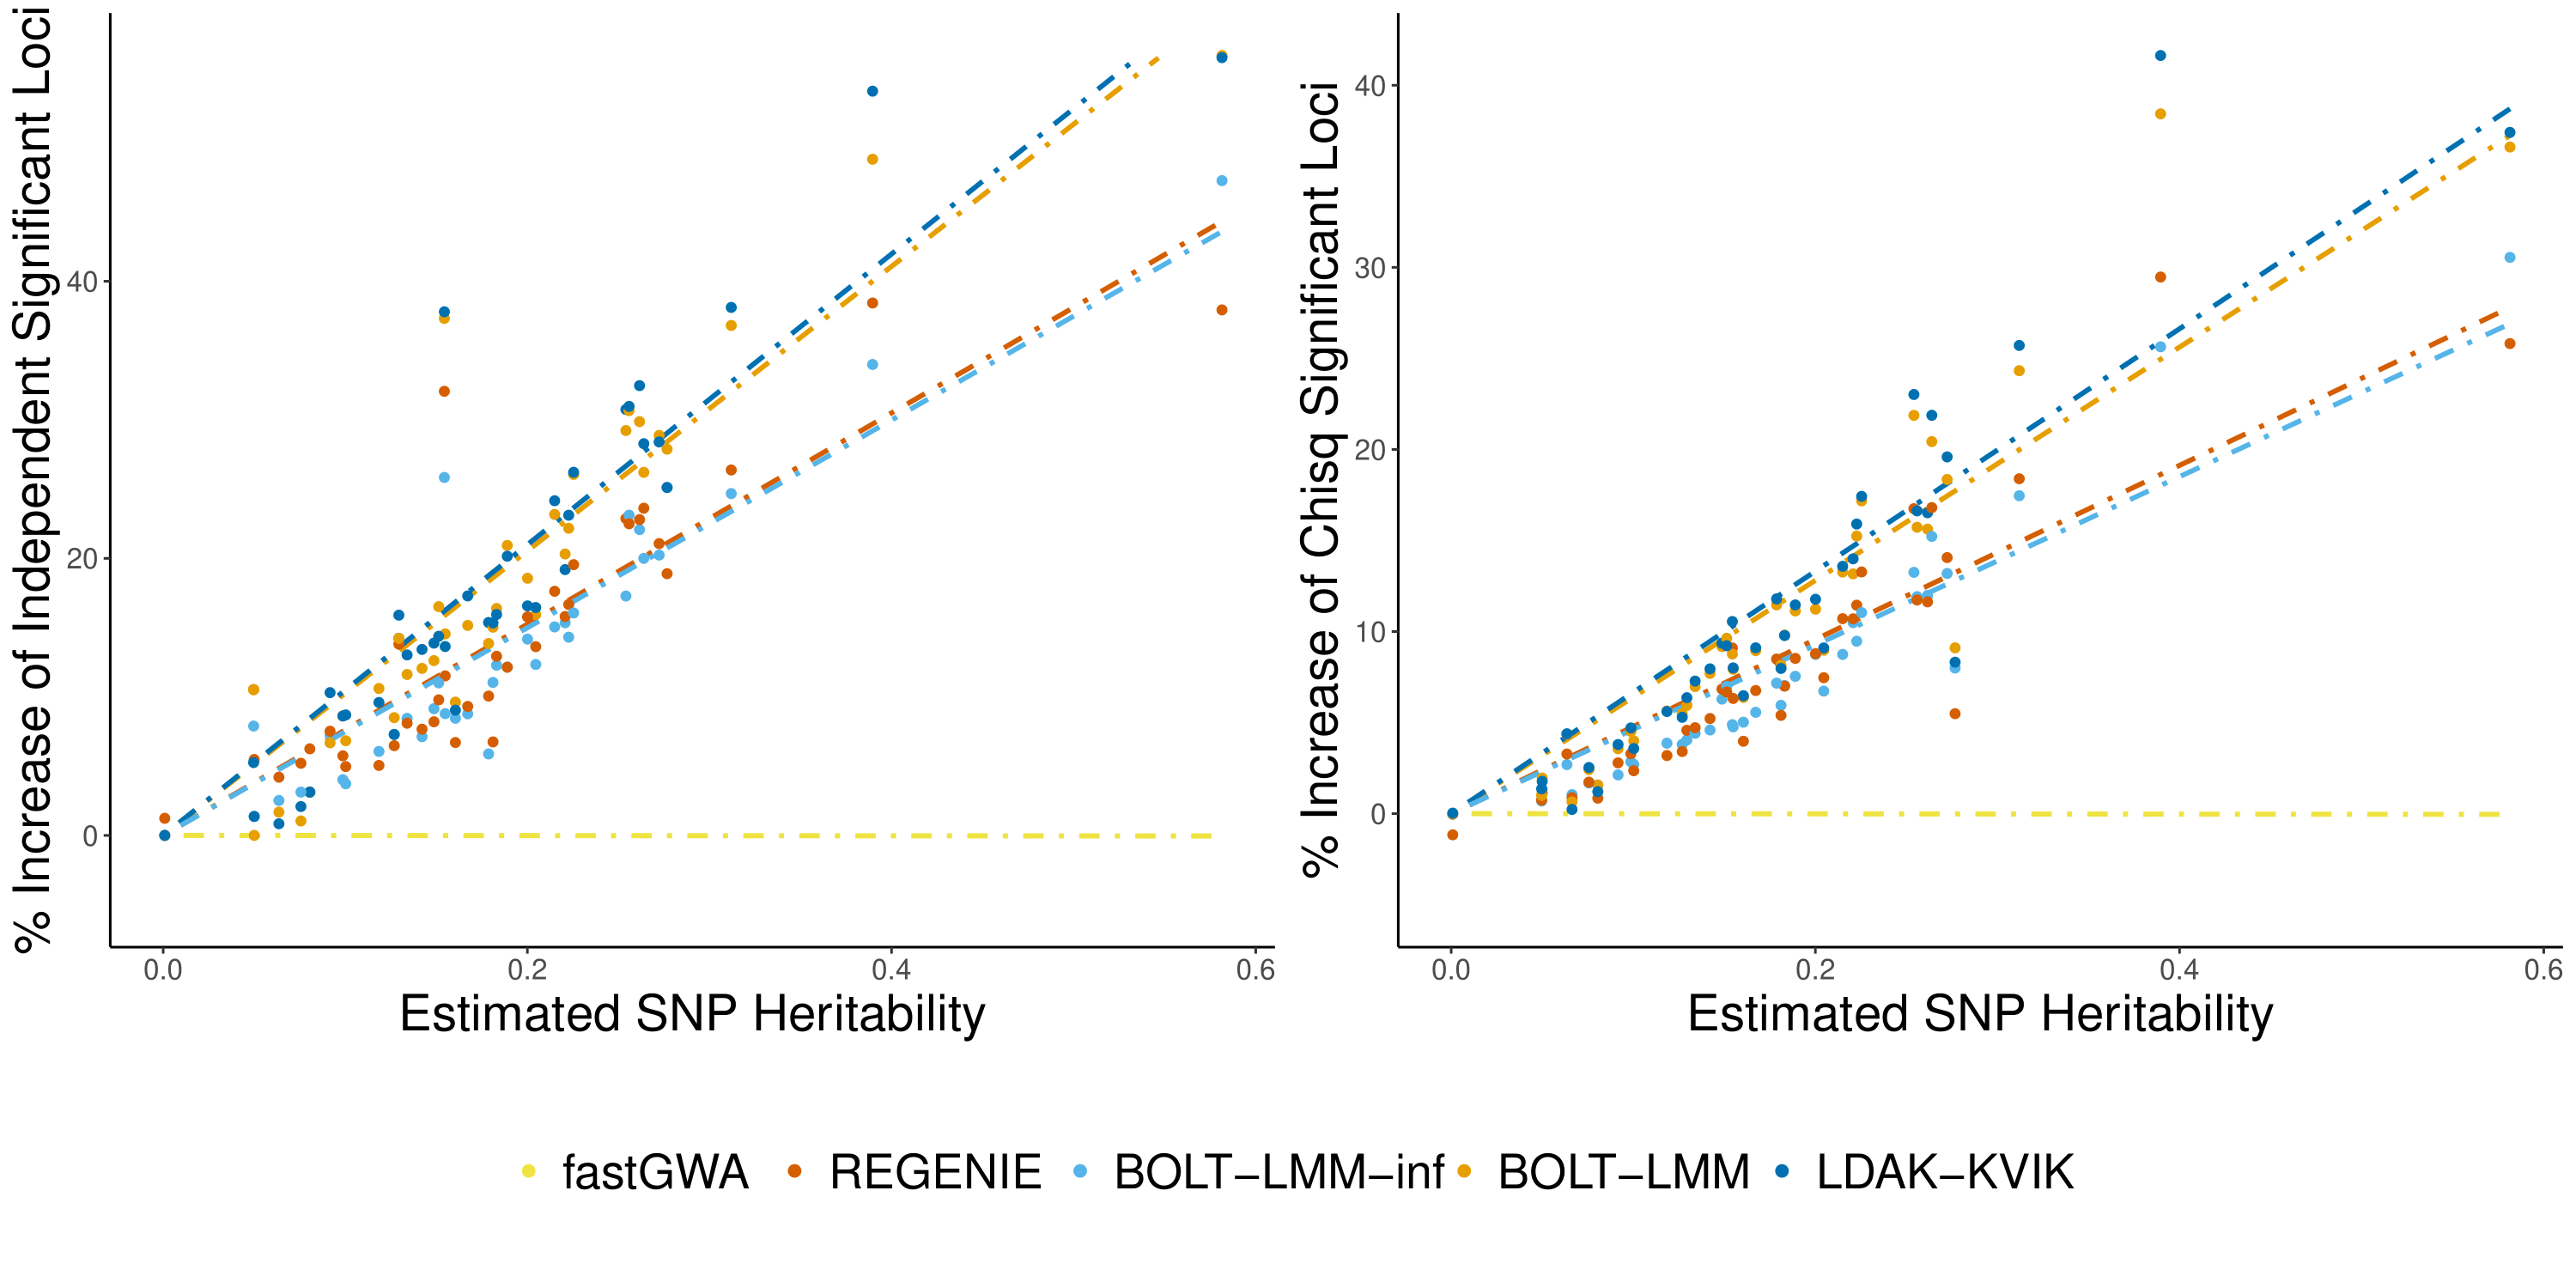
LDAK-KVIK found 17.9% more significant loci than fastGWA, whereas BOLT-LMM and REGENIE found 17.6% and 13.5% more, respectively. The right panel shows that the ranking of methods is similar when looking at chi square statistics of SNPs significant in linear regression.
Gene-based analysis
We applied the gene-based analysis of LDAK-KVIK to 40 quantiative and 20 binary traits from the UK Biobank, and compared its performance to LDAK-GBAT.
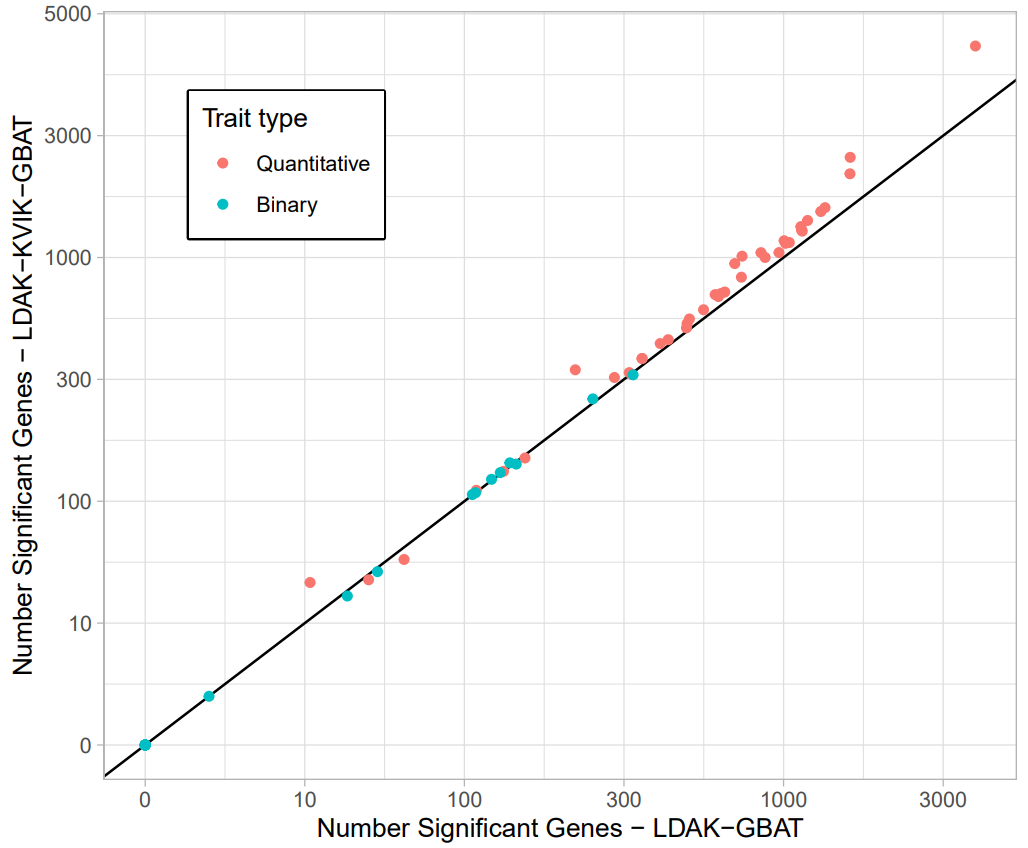
LDAK-KVIK-GBAT has improved power over LDAK-GBAT when analysing quantitative traits, finding 18.4% more significant genes on average. For binary traits, LDAK-KVIK-GBAT and LDAK-GBAT detect a similar number of significant genes, which reflects that there is a smaller power gain when using mixed-model association analysis for binary traits.
Simulation study
We simulated quantitative and binary phenotypes for various data sets:
- ‘Homogeneous’ dataset (63k unrelated White British individuals)
- ‘Family’ dataset (63k White British individuals, of which half are first-degree related relatives)
- ‘Twins’ dataset (constructed by duplicating the genotypes of 31,500 individuals of the homogeneous dataset)
Phenotypes were generated under different heritabilities (0.2 and 0.5) and number of causal SNPs (5k and 20k), with ten replicates for each scenario. Causal SNPs were randomly selected from the start of each chromosome, while SNPs located on the end of each chromosome served as null SNPs to evaluate type 1 error. For binary traits, we also varied the prevalance (10% and 1%).
Type 1 error
We evaluated the type 1 error of LDAK-KVIK for all scenarios as the mean \(\chi^2(1)\) statistic of null SNPs, and as the fraction of SNPs exceeding P value thresholds 0.05, 0.001 and 0.00005.
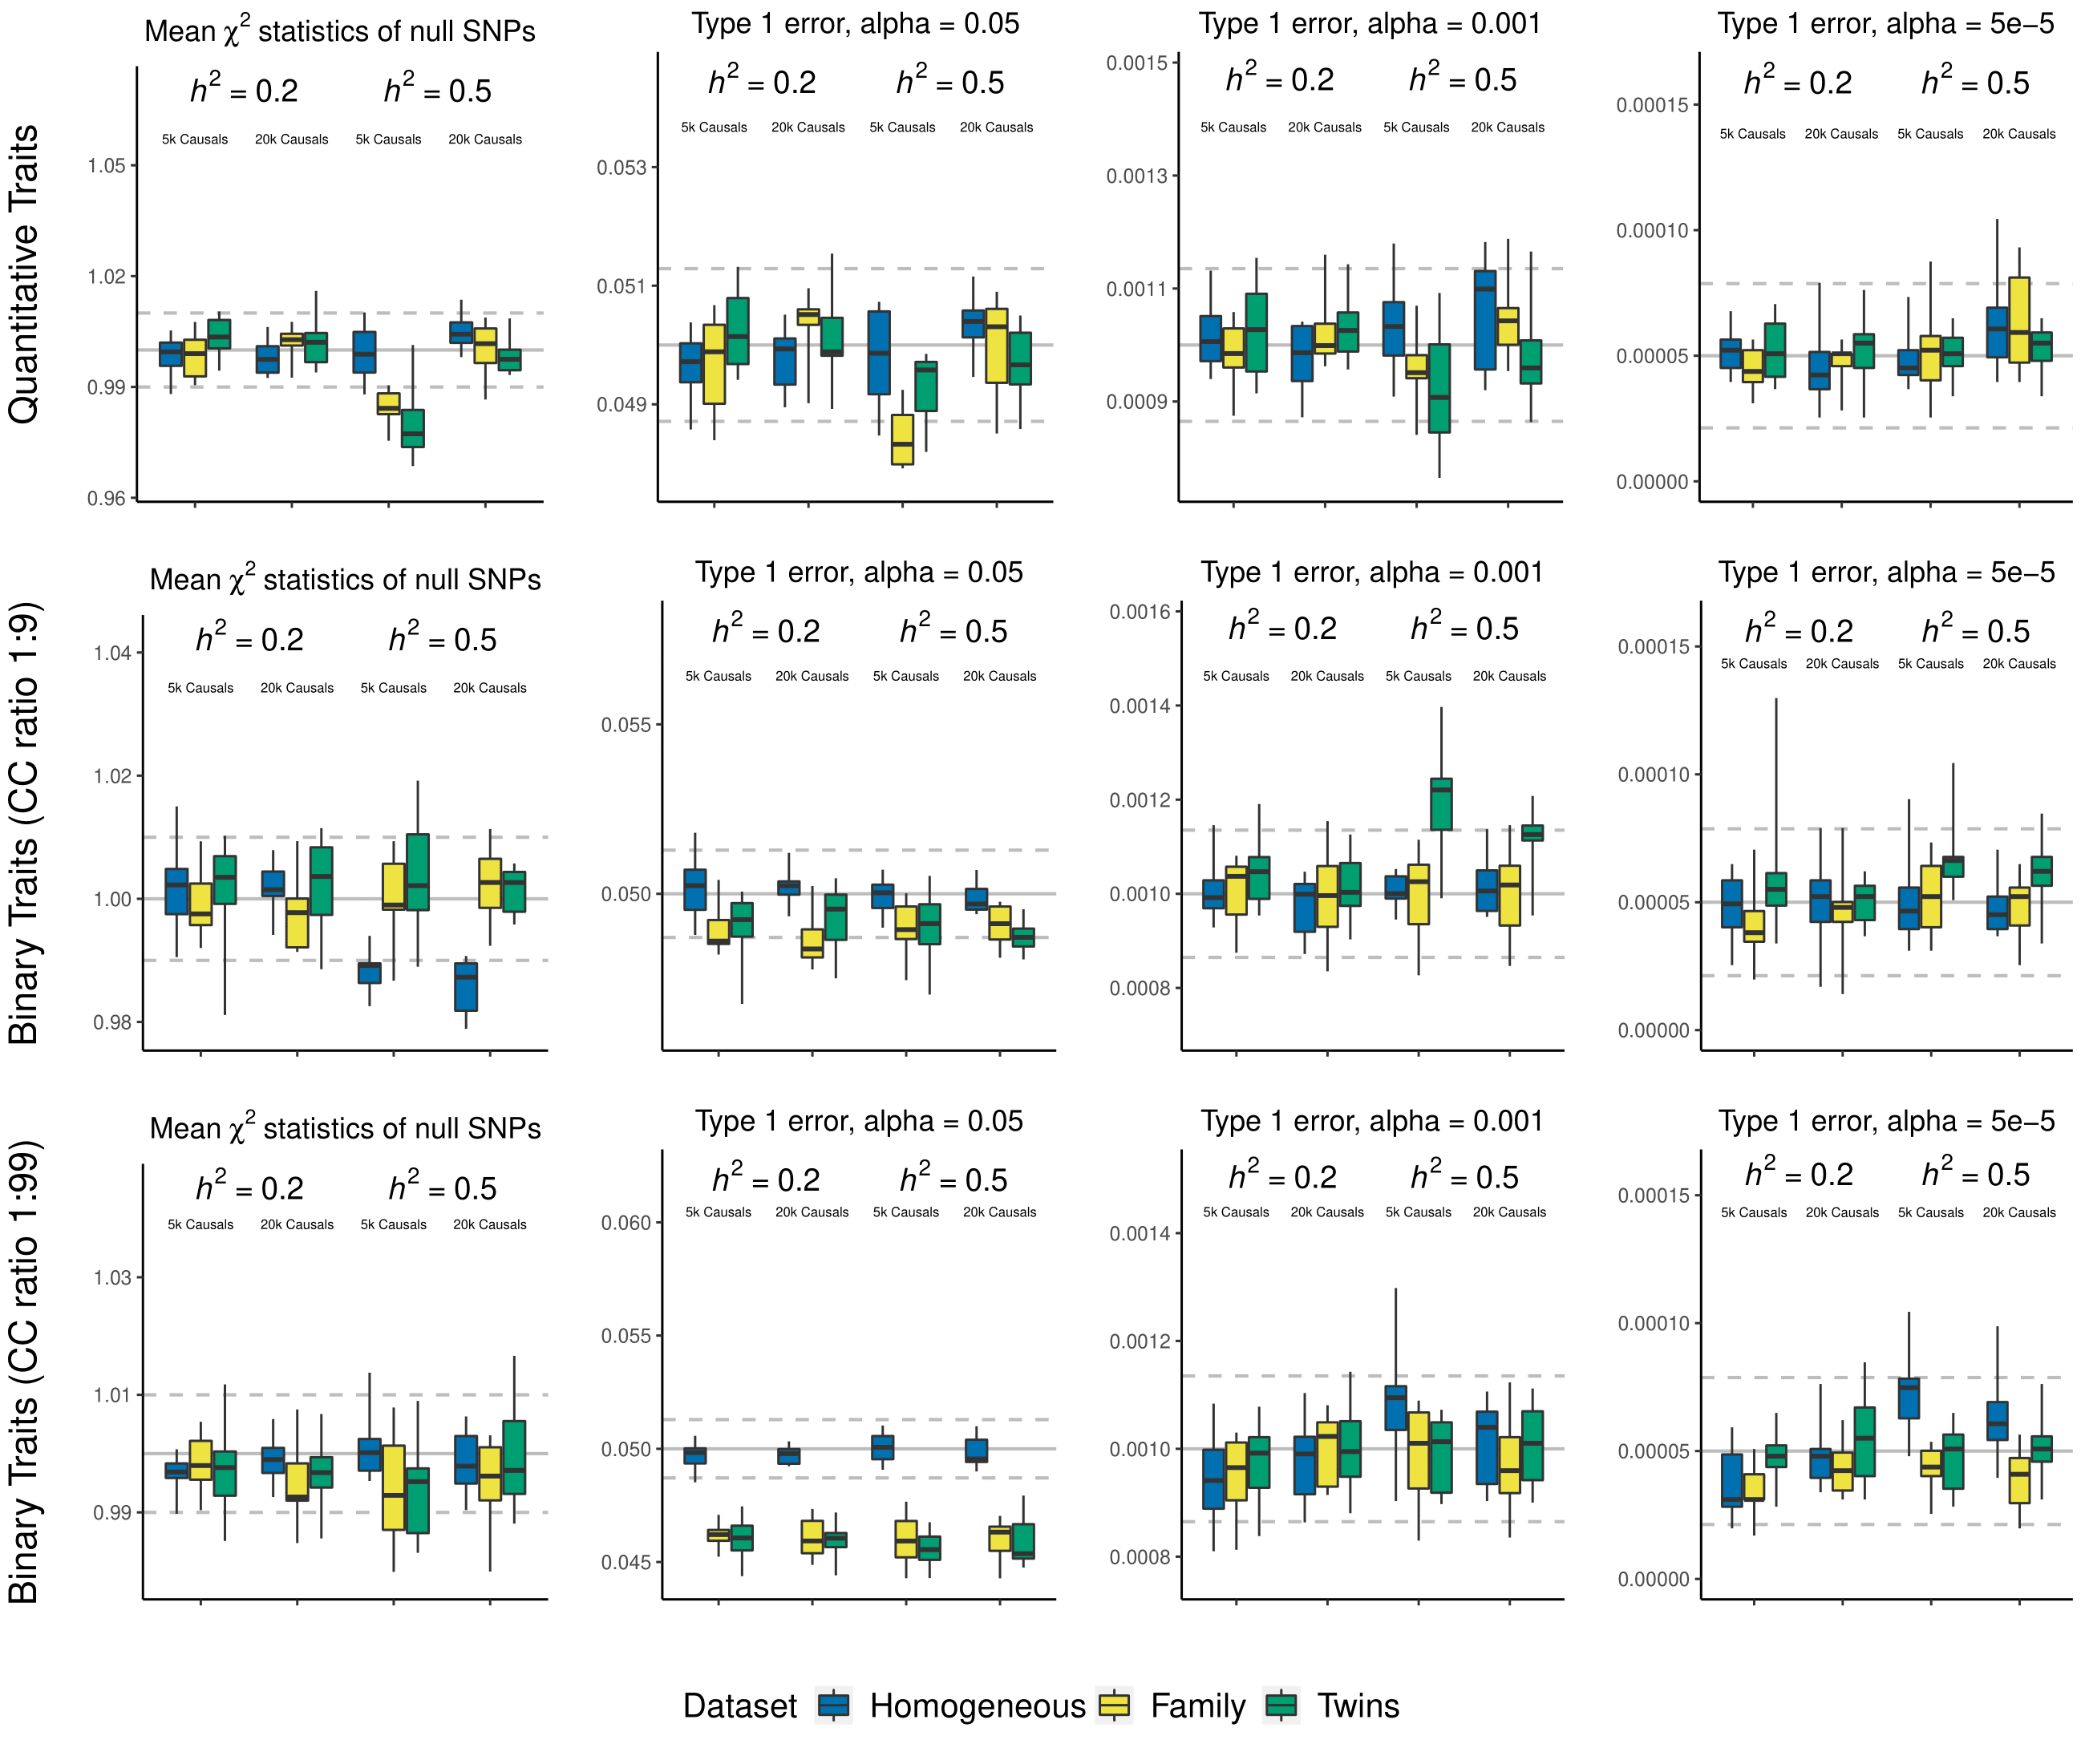
We find that LDAK-KVIK controls type 1 error for all datasets and scenarios considered. For example, the highest mean test statistic of null SNPs, averaged across ten replicates, is 1.0049, which occurs when analyzing the quantitative phenotypes with heritability 0.5 and 20k causal SNPs for the homogeneous dataset (the tenth box in the first panel).
Power
We compared the power of fastGWA, GCTA-LOCO, REGENIE, BOLT-LMM and LDAK-KVIK for quantitative traits by evaluating the mean \(\chi^2(1)\) statistics of causal SNPs (located at the start of each chromosome in our simulations).
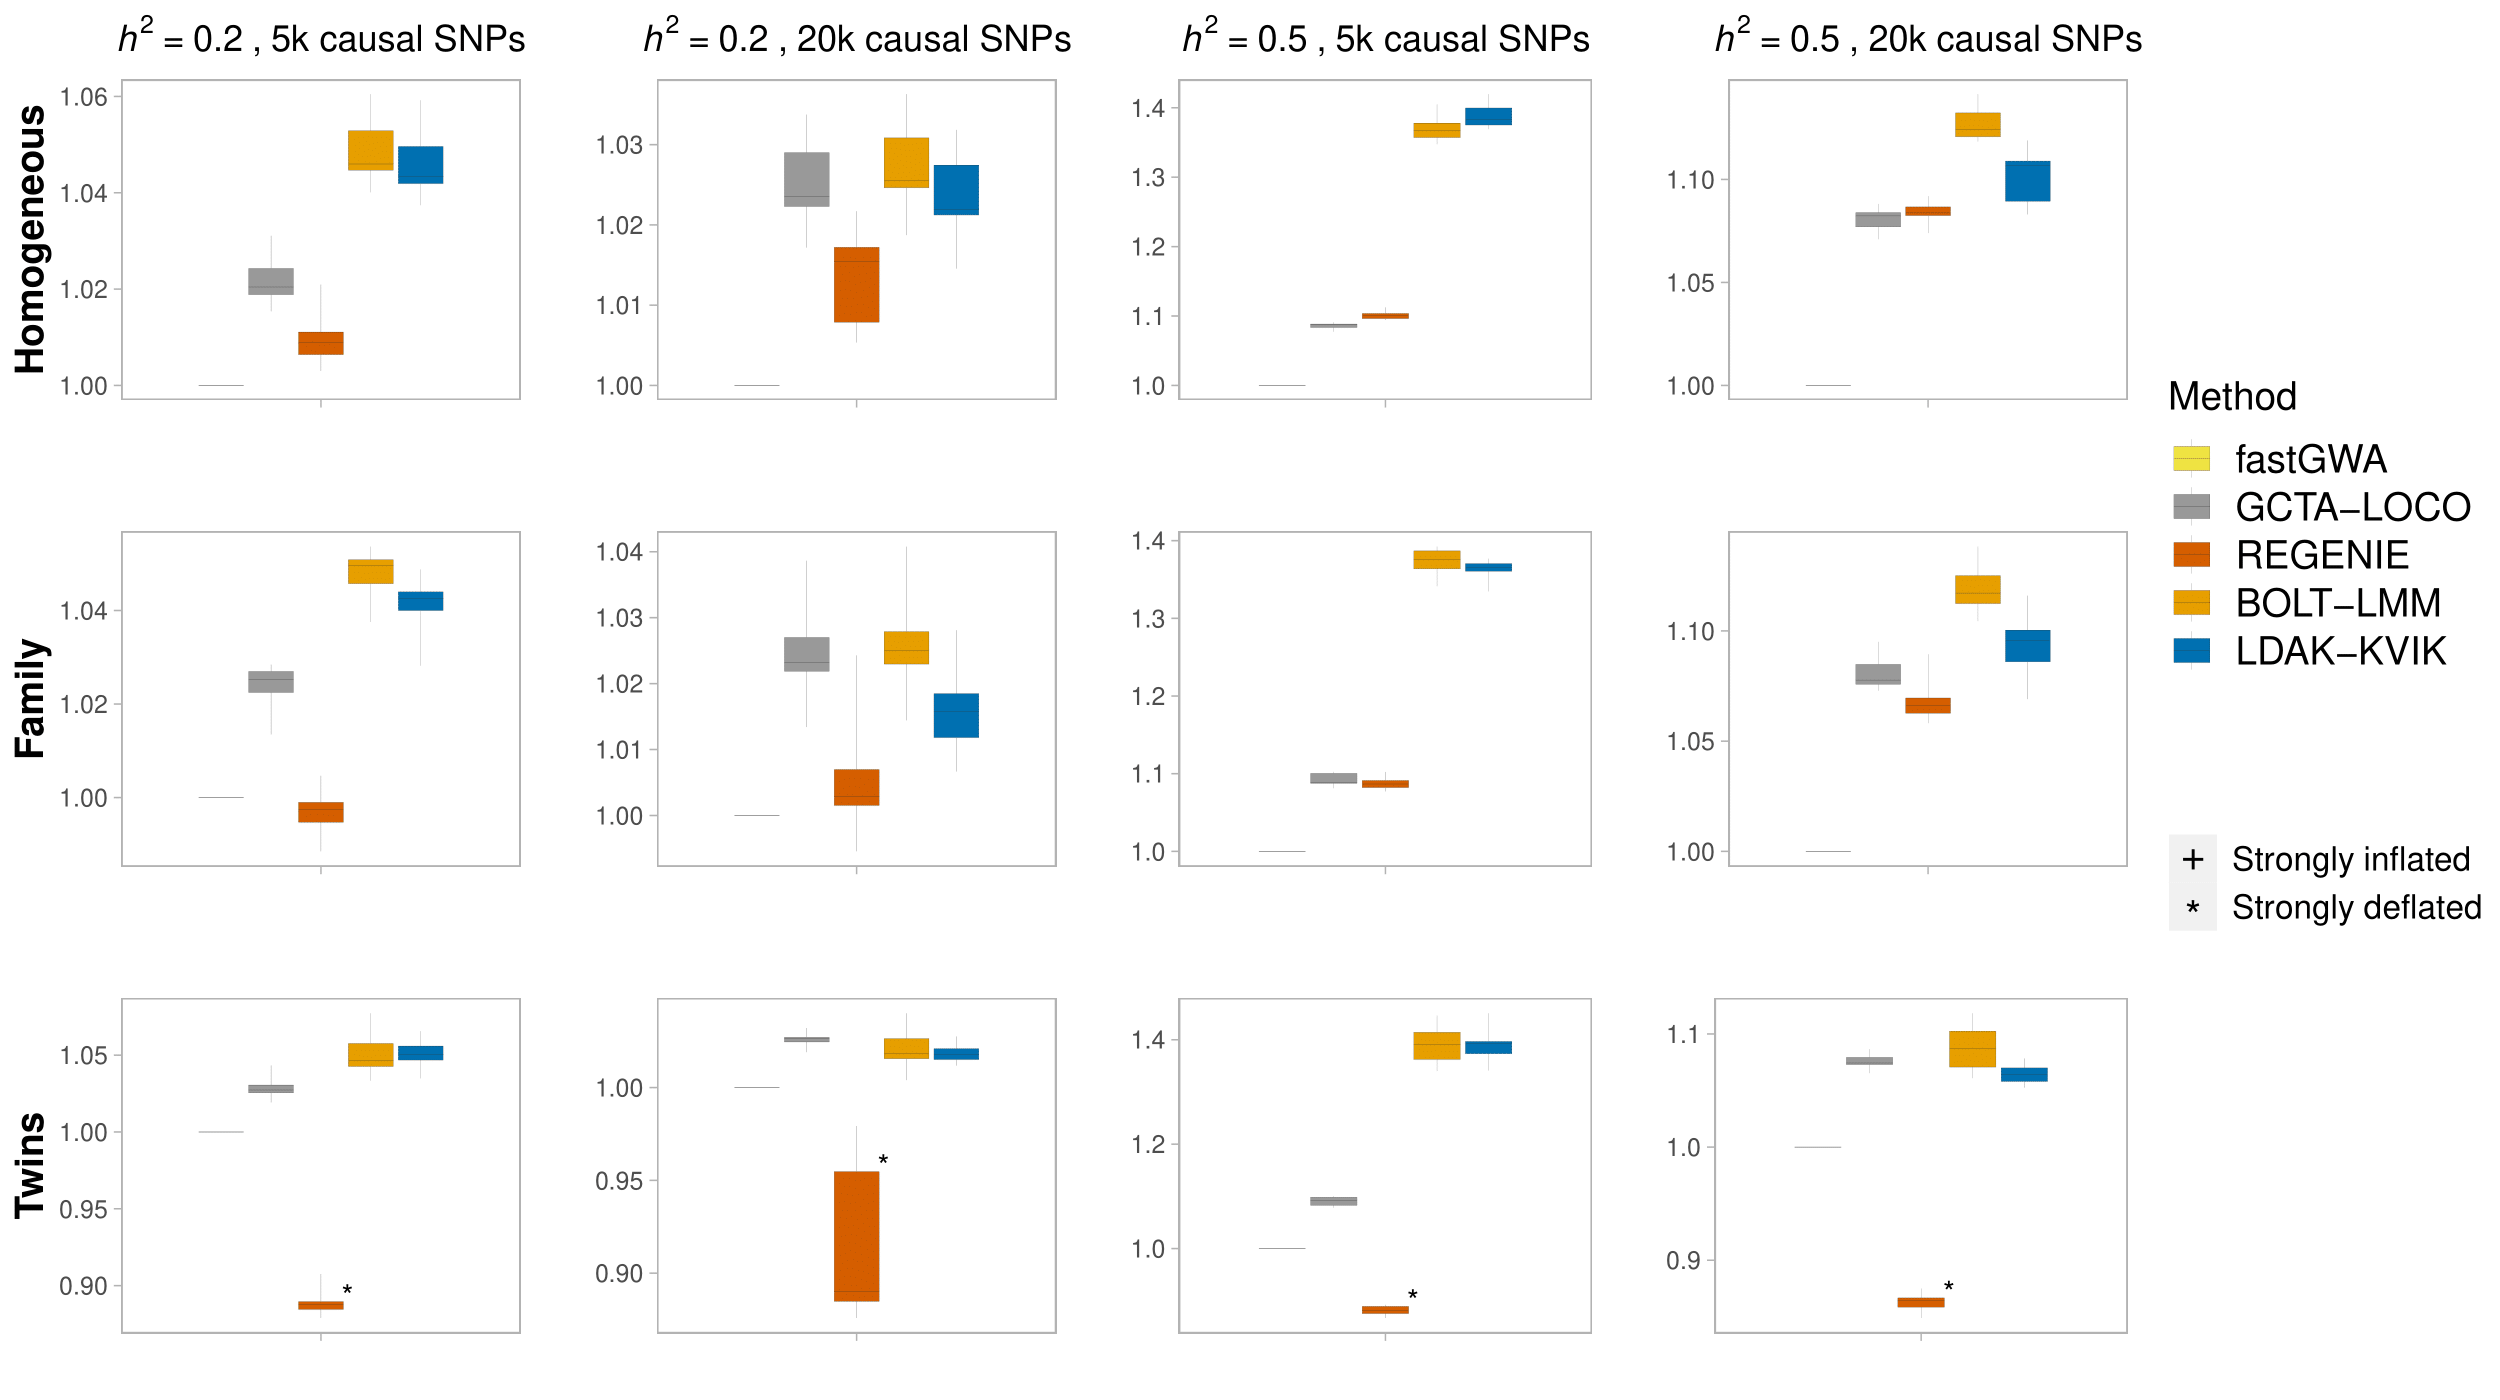
Note that the marks “*” and “+” indicate whether the MMAA tool has significant deflation (average chi squared statistic < 0.98) or inflation (average chi squared statistic > 1.02) for the corresponding simulation scenario.
Across all scenarios considered, LDAK-KVIK and BOLT-LMM are the two most powerful MMAA tools, ahead of REGENIE and GCTA-LOCO, while fastGWA generally has lowest power.
